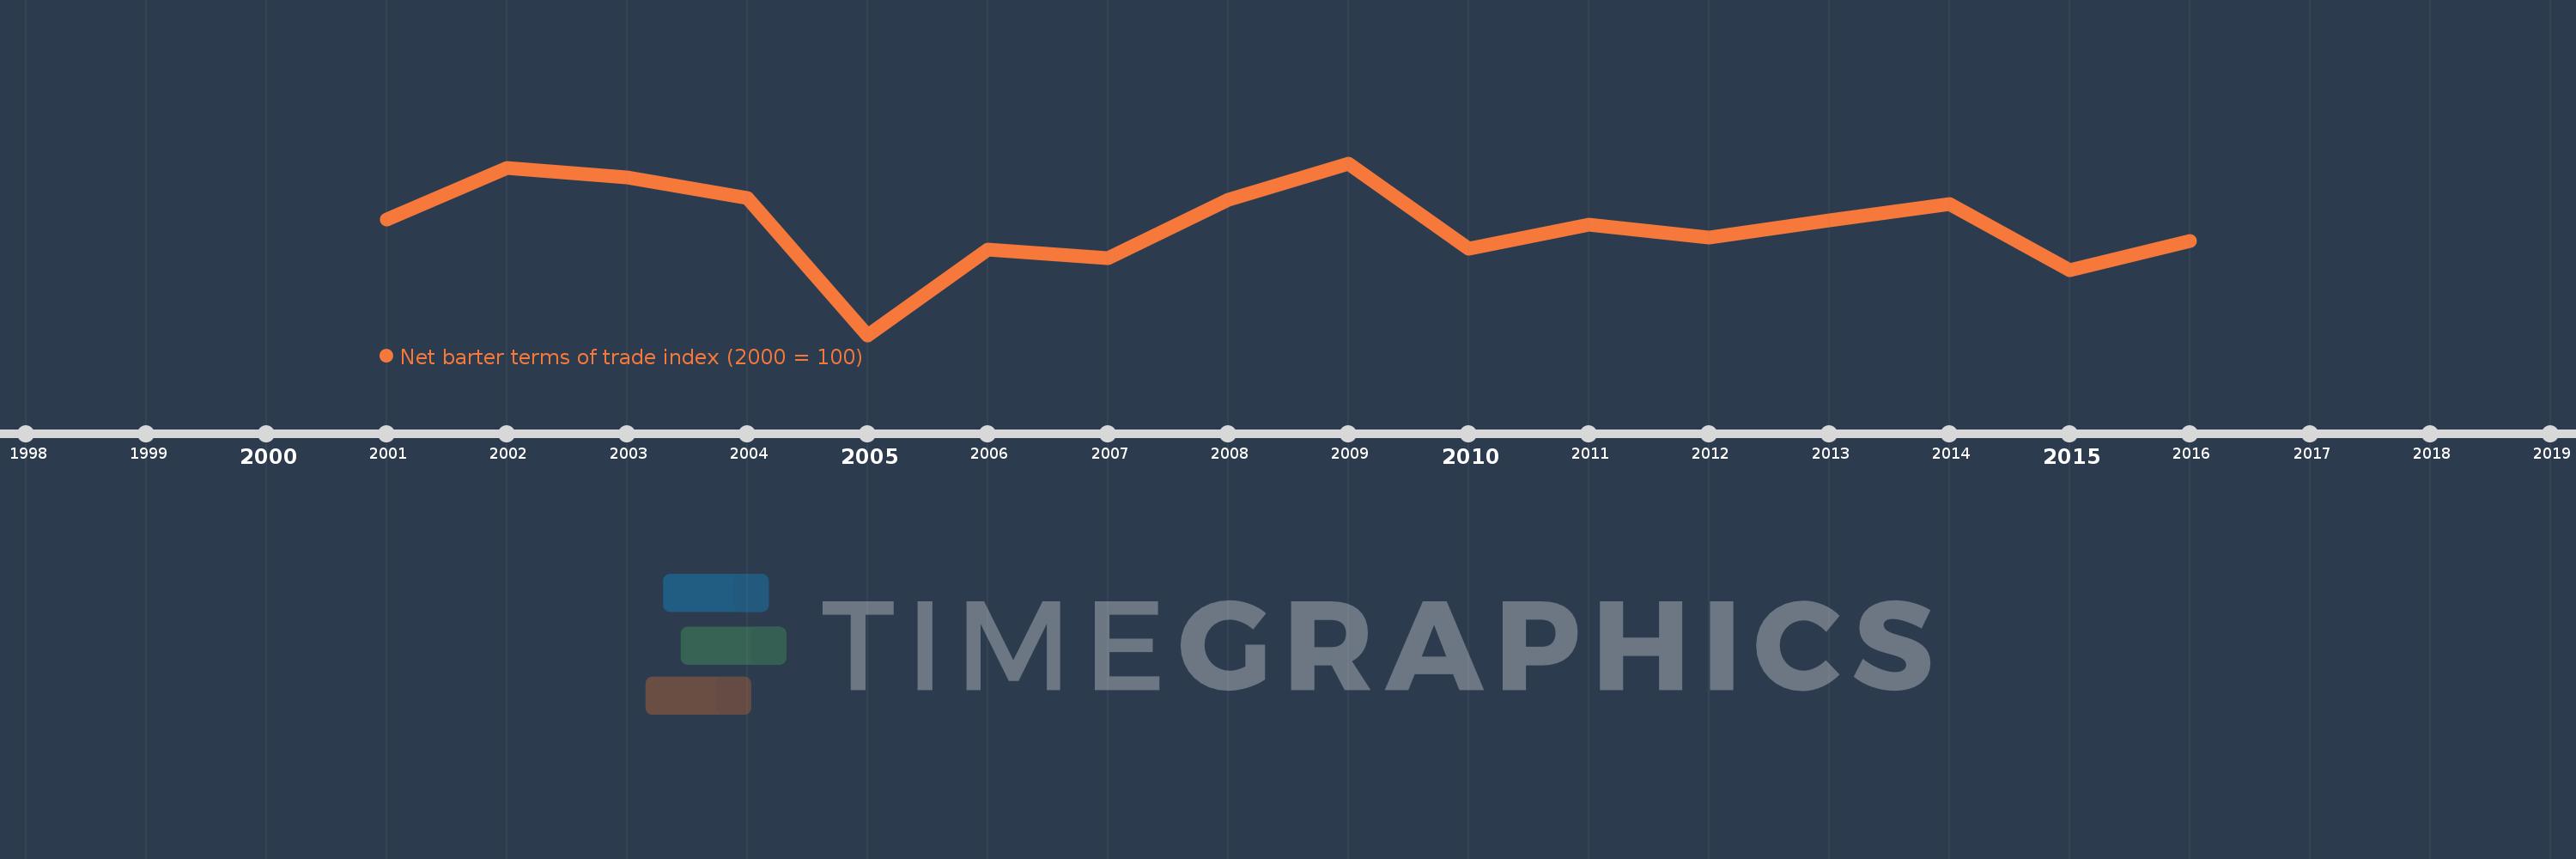
This timeline shows a graph from 2001 to 2016 of Denmark. No data until 2000. Number of actual observations by date: 16.
Source name:
World Development Indicators
Source organization:
United Nations Conference on Trade and Development, Handbook of Statistics and data files, and International Monetary Fund, International Financial Statistics.
Categories, topics:
Private Sector, Trade
Last updated:
apr 23, 2017
Indicators value changes by year
Meaning:
99.858
Minimum:
97.502
jan 1, 2005
Maximum:
101.212
jan 1, 2009
At the date of observation
Value
Absolute change
Change from the previous value
jan 1, 2001
100.0
+100.0
0.0%
jan 1, 2002
101.113
+1.113
1.11%
jan 1, 2003
100.9
-0.213
-0.21%
jan 1, 2004
100.461
-0.44
-0.44%
jan 1, 2005
97.502
-2.959
-2.95%
jan 1, 2006
99.357
+1.855
1.9%
jan 1, 2007
99.169
-0.188
-0.19%
jan 1, 2008
100.417
+1.248
1.26%
jan 1, 2009
101.212
+0.795
0.79%
jan 1, 2010
99.363
-1.848
-1.83%
jan 1, 2011
99.888
+0.525
0.53%
jan 1, 2012
99.607
-0.281
-0.28%
jan 1, 2013
99.978
+0.371
0.37%
jan 1, 2014
100.338
+0.36
0.36%
jan 1, 2015
98.899
-1.439
-1.43%
jan 1, 2016
99.532
+0.633
0.64%
Ranking of countries by current statistics by years