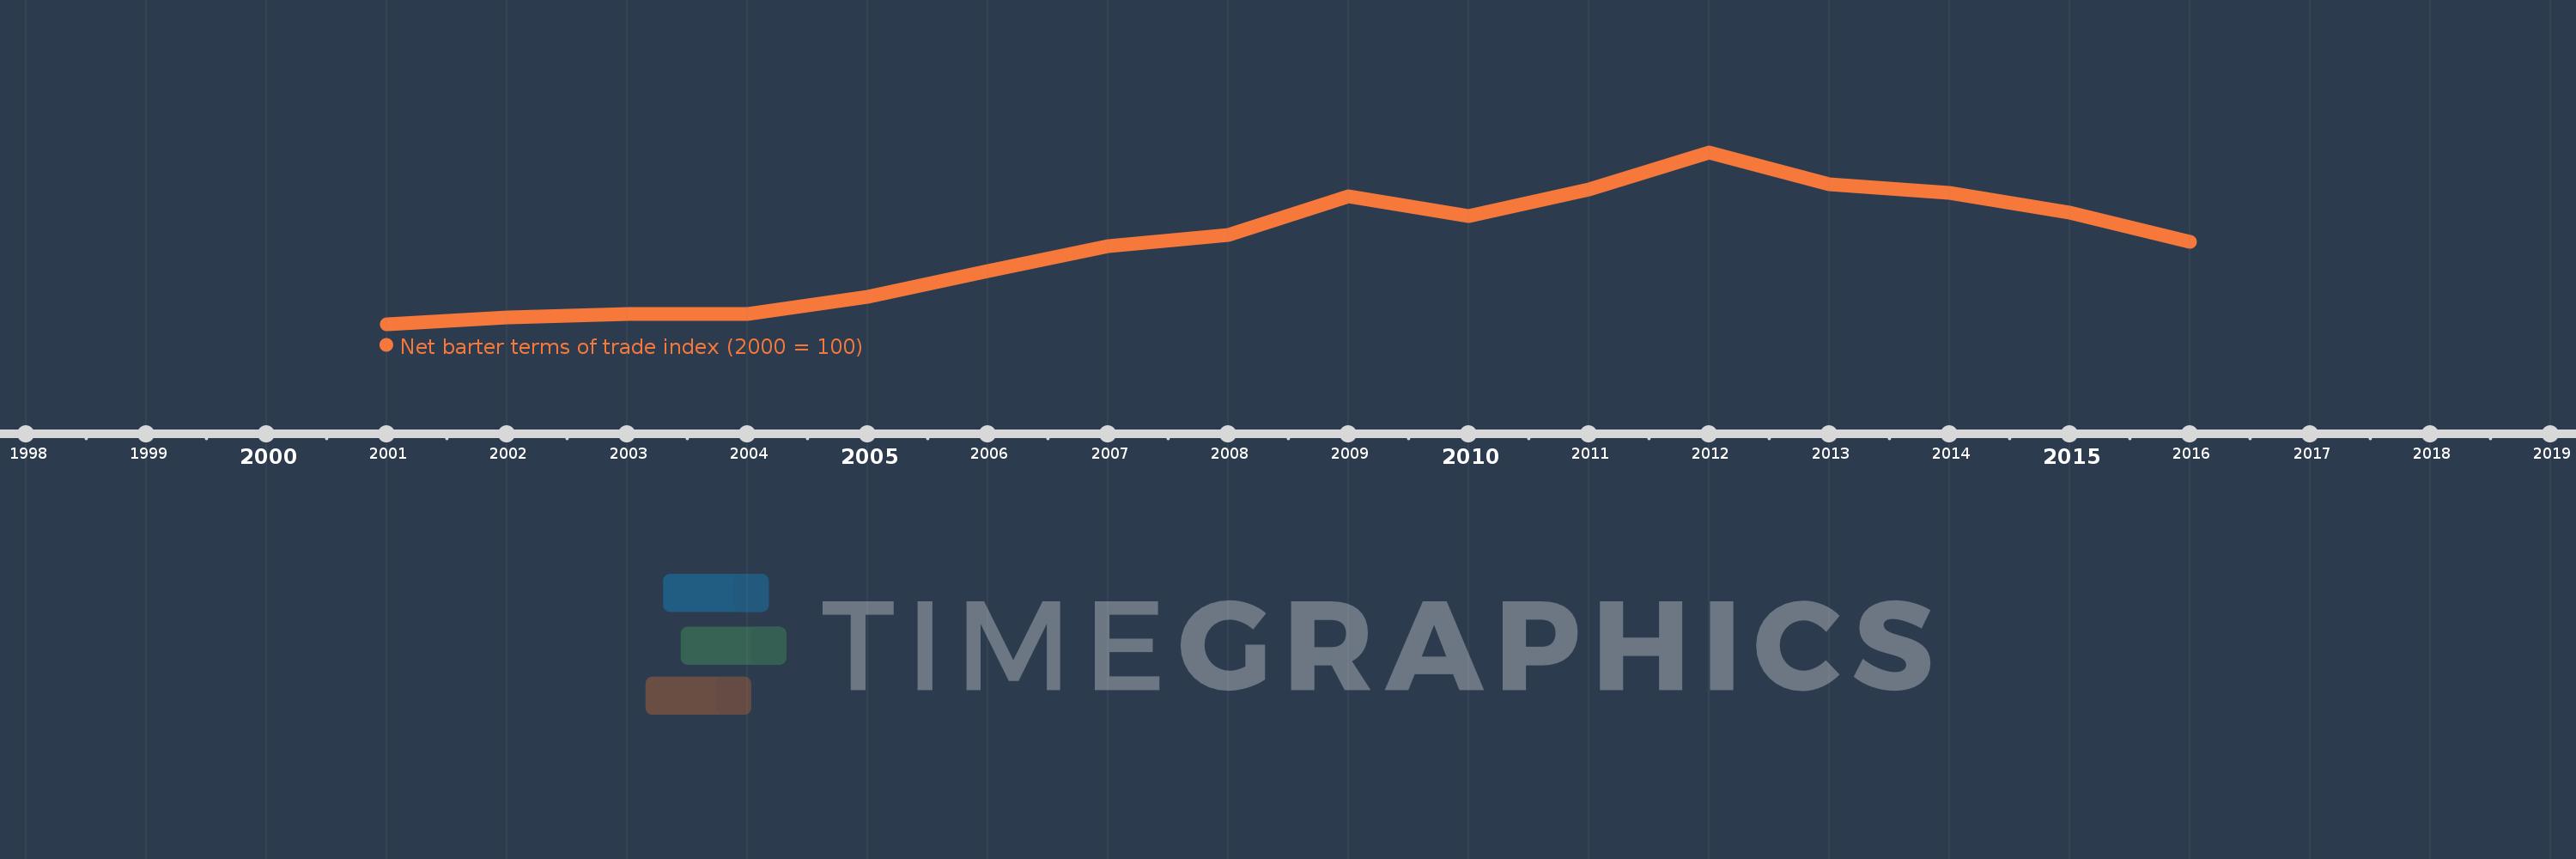
This timeline shows a graph from 2001 to 2016 of Australia. No data until 2000. Number of actual observations by date: 16.
Source name:
World Development Indicators
Source organization:
United Nations Conference on Trade and Development, Handbook of Statistics and data files, and International Monetary Fund, International Financial Statistics.
Categories, topics:
Private Sector, Trade
Last updated:
apr 23, 2017
Indicators value changes by year
Meaning:
146.895
Minimum:
100.0
jan 1, 2001
Maximum:
200.433
jan 1, 2012
At the date of observation
Value
Absolute change
Change from the previous value
jan 1, 2001
100.0
+100.0
0.0%
jan 1, 2002
104.075
+4.075
4.08%
jan 1, 2003
105.849
+1.774
1.7%
jan 1, 2004
105.924
+0.074
0.07%
jan 1, 2005
116.176
+10.252
9.68%
jan 1, 2006
131.085
+14.909
12.83%
jan 1, 2007
145.516
+14.431
11.01%
jan 1, 2008
152.391
+6.875
4.72%
jan 1, 2009
174.631
+22.239
14.59%
jan 1, 2010
162.976
-11.655
-6.67%
jan 1, 2011
178.9
+15.925
9.77%
jan 1, 2012
200.433
+21.533
12.04%
jan 1, 2013
181.991
-18.442
-9.2%
jan 1, 2014
176.992
-5.0
-2.75%
jan 1, 2015
165.074
-11.918
-6.73%
jan 1, 2016
148.302
-16.772
-10.16%
Ranking of countries by current statistics by years