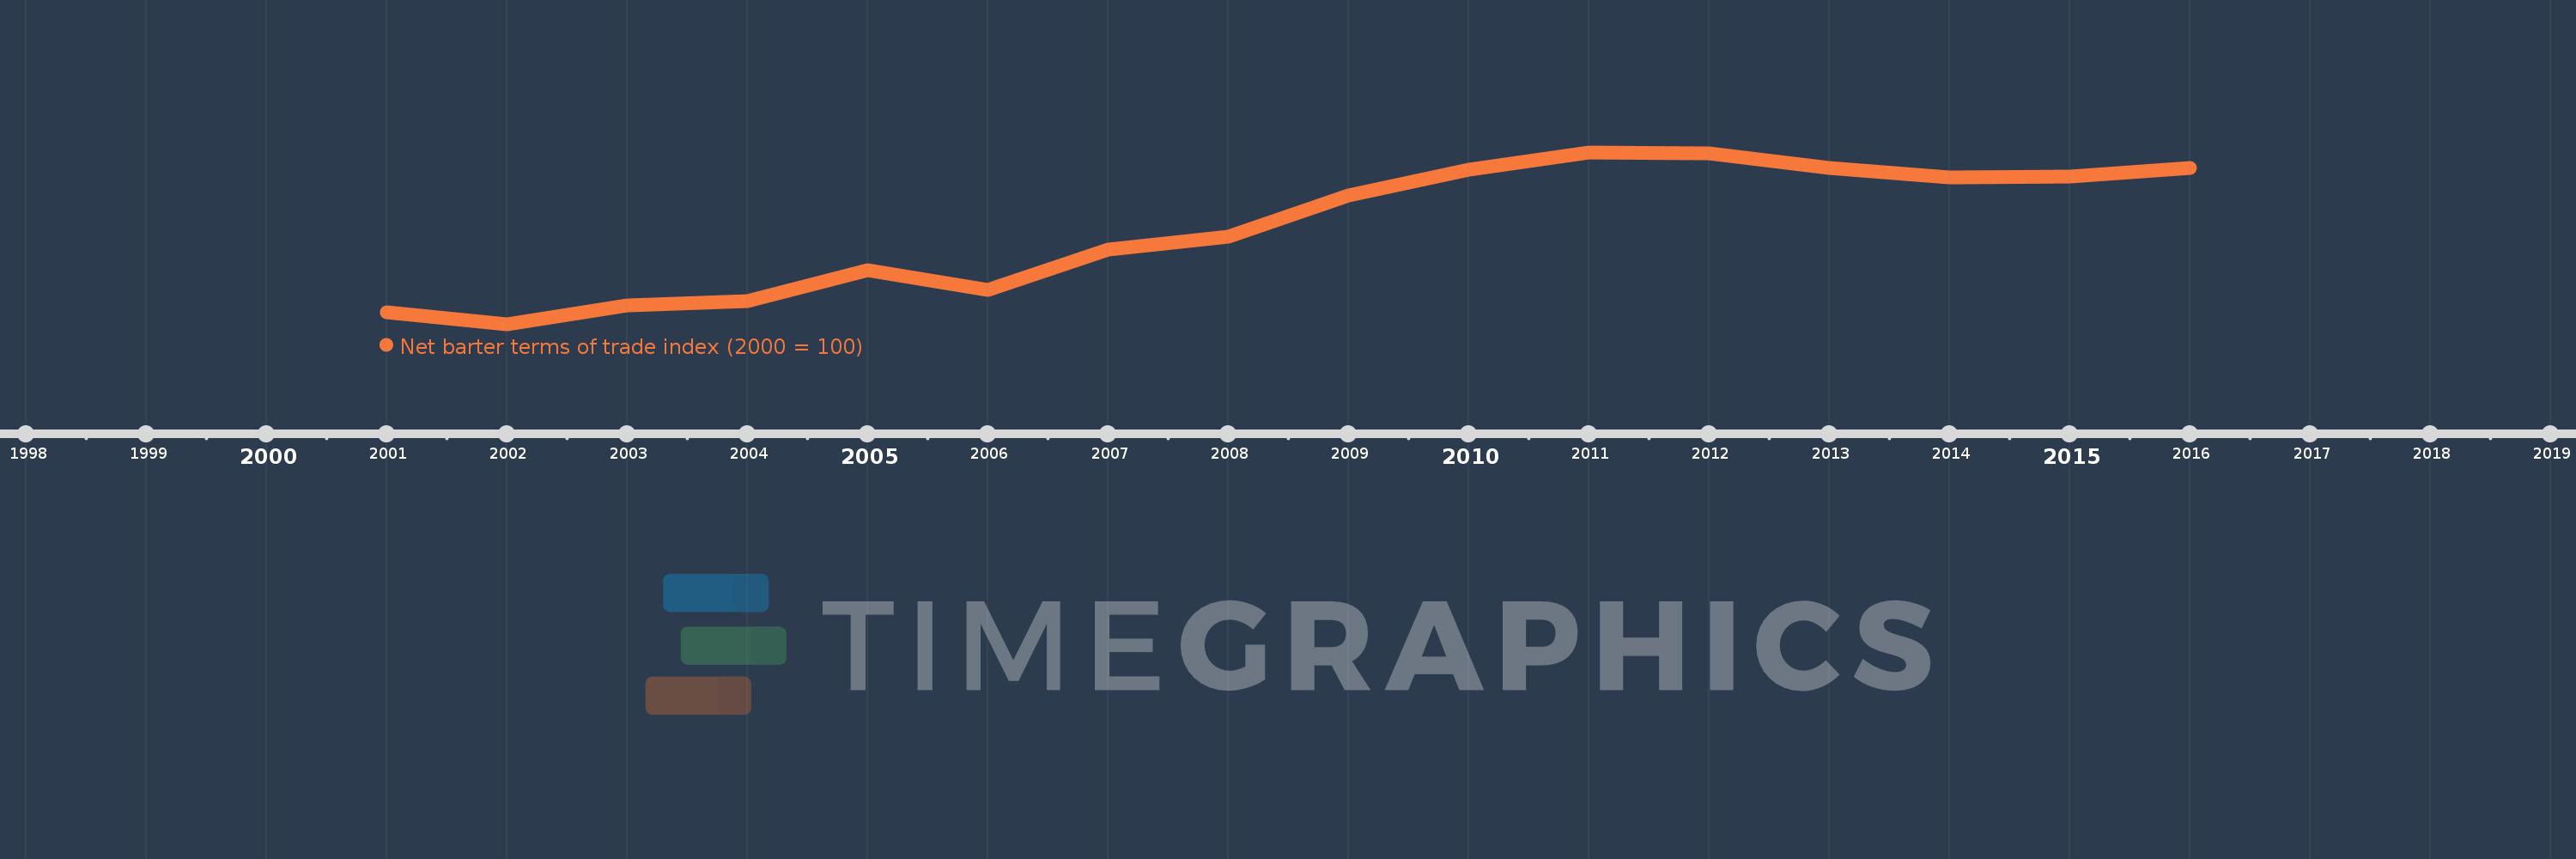
This timeline shows a graph from 2001 to 2016 of Georgia. No data until 2000. Number of actual observations by date: 16.
Source name:
World Development Indicators
Source organization:
United Nations Conference on Trade and Development, Handbook of Statistics and data files, and International Monetary Fund, International Financial Statistics.
Categories, topics:
Private Sector, Trade
Last updated:
apr 23, 2017
Indicators value changes by year
Meaning:
119.634
Minimum:
97.248
jan 1, 2002
Maximum:
137.253
jan 1, 2011
At the date of observation
Value
Absolute change
Change from the previous value
jan 1, 2001
100.0
+100.0
0.0%
jan 1, 2002
97.248
-2.752
-2.75%
jan 1, 2003
101.637
+4.389
4.51%
jan 1, 2004
102.539
+0.902
0.89%
jan 1, 2005
109.773
+7.234
7.05%
jan 1, 2006
105.322
-4.451
-4.05%
jan 1, 2007
114.62
+9.297
8.83%
jan 1, 2008
117.721
+3.102
2.71%
jan 1, 2009
127.208
+9.487
8.06%
jan 1, 2010
133.289
+6.081
4.78%
jan 1, 2011
137.253
+3.964
2.97%
jan 1, 2012
137.064
-0.19
-0.14%
jan 1, 2013
133.672
-3.392
-2.47%
jan 1, 2014
131.514
-2.158
-1.61%
jan 1, 2015
131.719
+0.205
0.16%
jan 1, 2016
133.566
+1.847
1.4%
Ranking of countries by current statistics by years