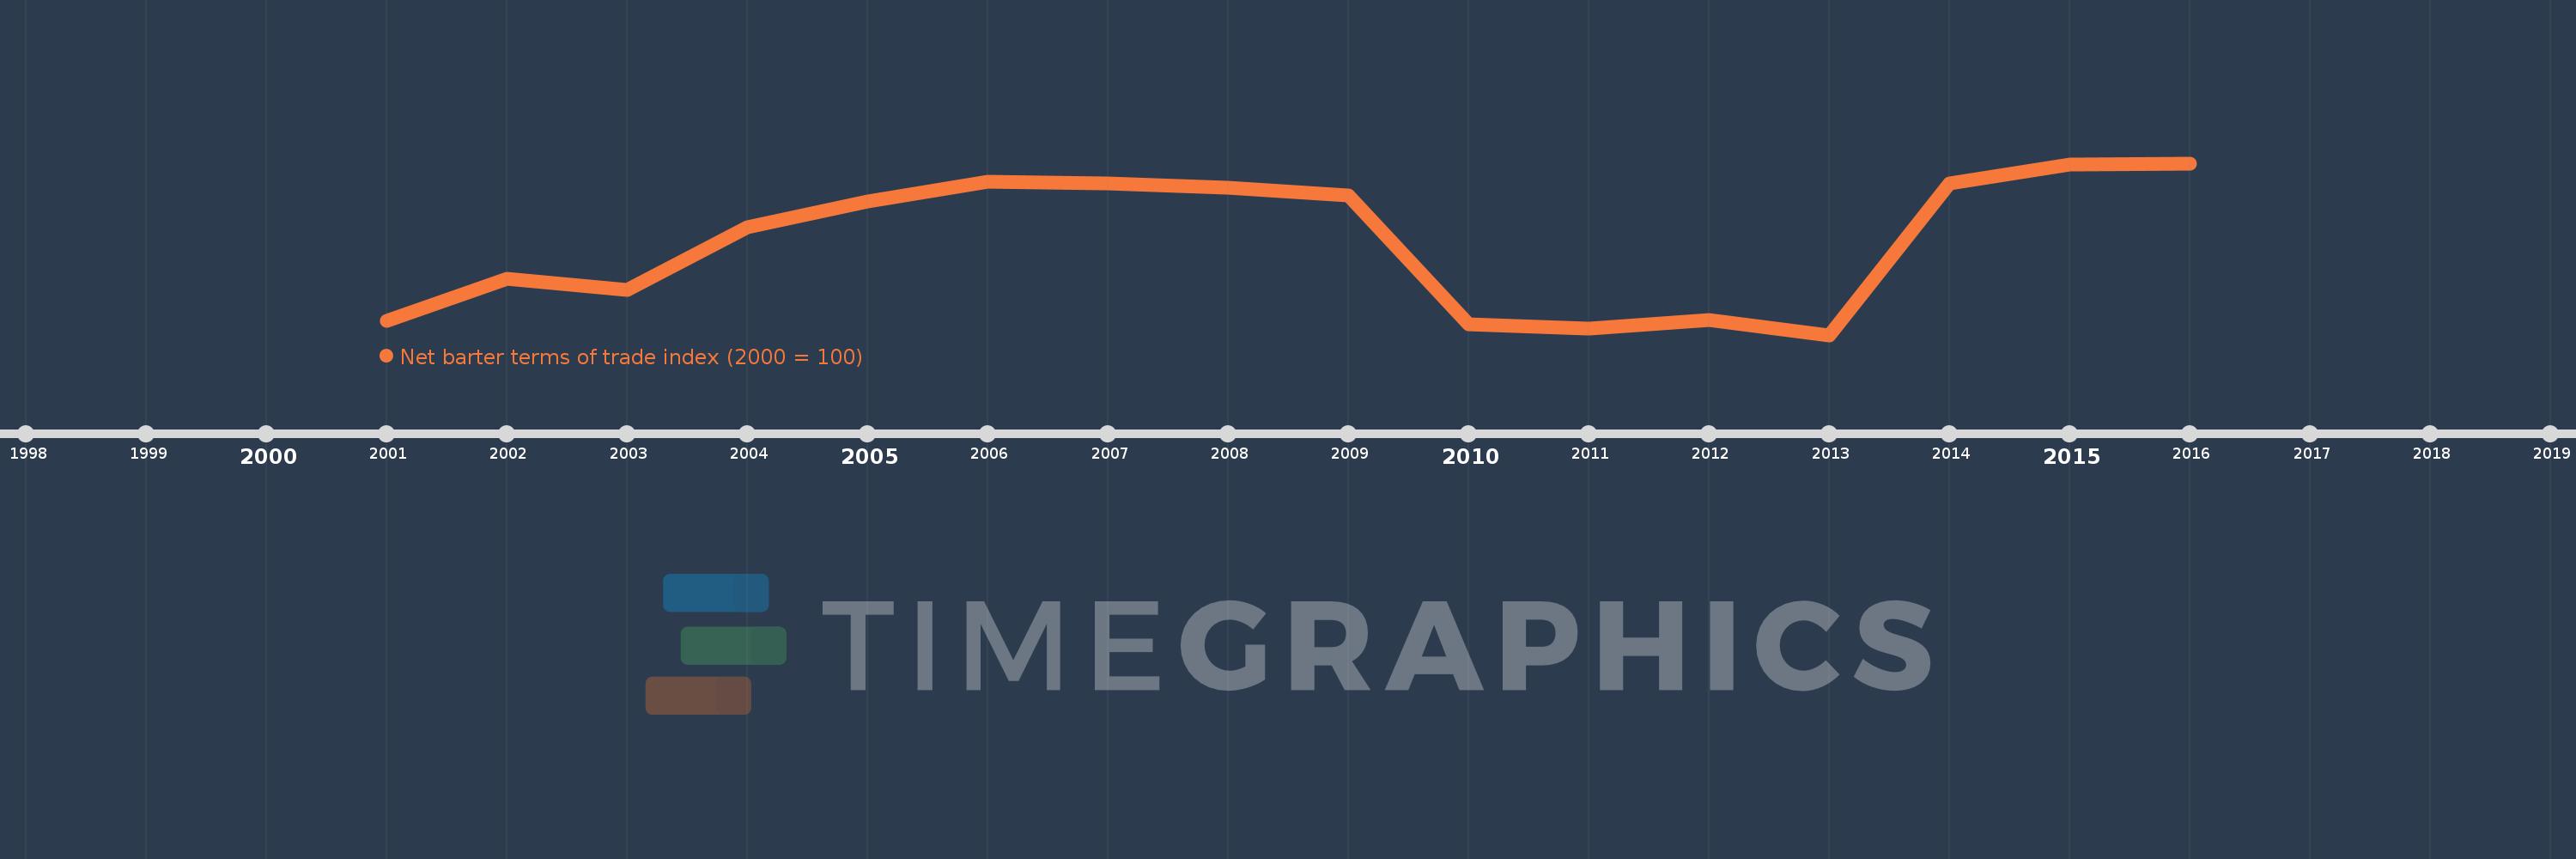
This timeline shows a graph from 2001 to 2016 of Marshall Islands. No data until 2000. Number of actual observations by date: 16.
Source name:
World Development Indicators
Source organization:
United Nations Conference on Trade and Development, Handbook of Statistics and data files, and International Monetary Fund, International Financial Statistics.
Categories, topics:
Private Sector, Trade
Last updated:
apr 23, 2017
Indicators value changes by year
Meaning:
104.147
Minimum:
99.23
jan 1, 2013
Maximum:
108.389
jan 1, 2016
At the date of observation
Value
Absolute change
Change from the previous value
jan 1, 2001
100.0
+100.0
0.0%
jan 1, 2002
102.238
+2.238
2.24%
jan 1, 2003
101.655
-0.583
-0.57%
jan 1, 2004
104.966
+3.312
3.26%
jan 1, 2005
106.371
+1.405
1.34%
jan 1, 2006
107.399
+1.027
0.97%
jan 1, 2007
107.329
-0.069
-0.06%
jan 1, 2008
107.065
-0.264
-0.25%
jan 1, 2009
106.652
-0.413
-0.39%
jan 1, 2010
99.818
-6.834
-6.41%
jan 1, 2011
99.552
-0.266
-0.27%
jan 1, 2012
100.045
+0.493
0.5%
jan 1, 2013
99.23
-0.815
-0.81%
jan 1, 2014
107.312
+8.081
8.14%
jan 1, 2015
108.33
+1.018
0.95%
jan 1, 2016
108.389
+0.059
0.05%
Ranking of countries by current statistics by years