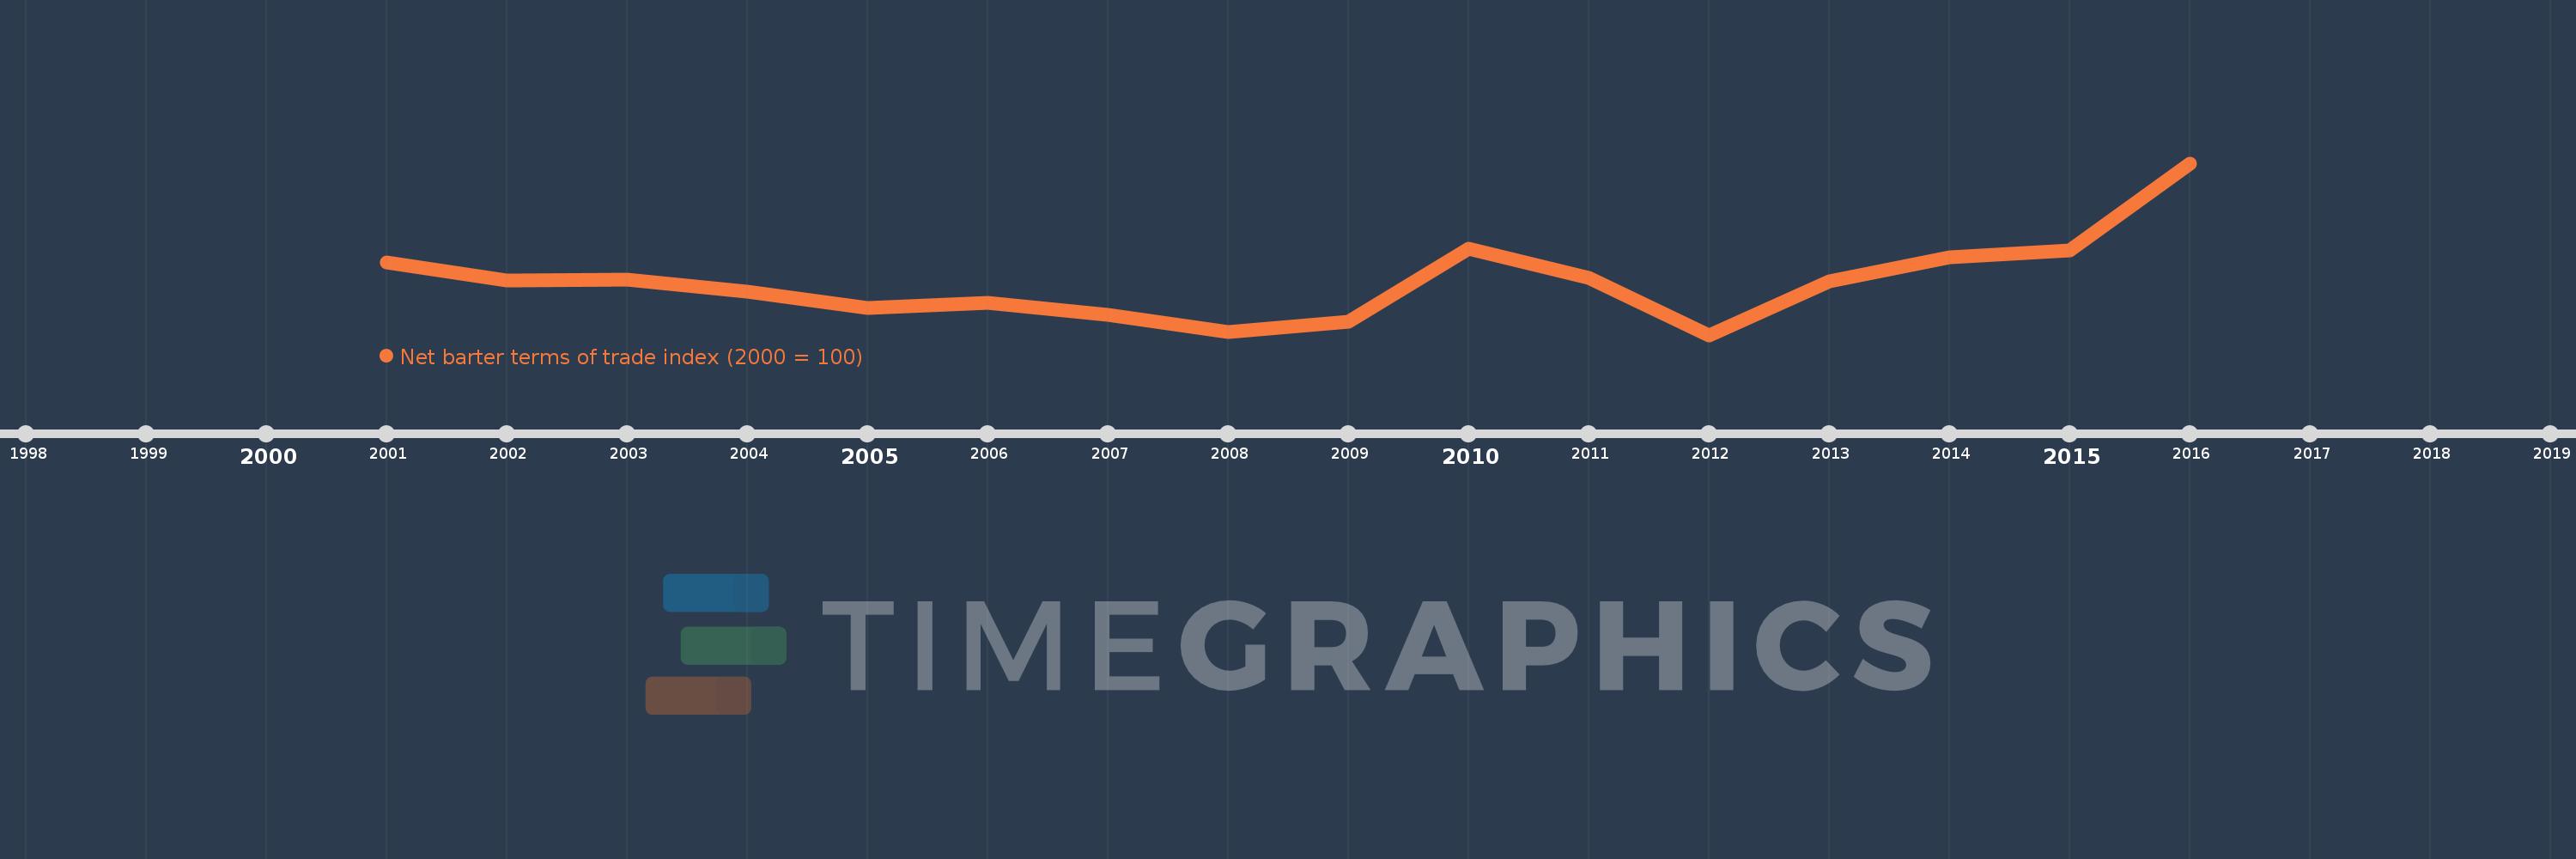
This timeline shows a graph from 2001 to 2016 of Israel. No data until 2000. Number of actual observations by date: 16.
Source name:
World Development Indicators
Source organization:
United Nations Conference on Trade and Development, Handbook of Statistics and data files, and International Monetary Fund, International Financial Statistics.
Categories, topics:
Private Sector, Trade
Last updated:
apr 23, 2017
Indicators value changes by year
Meaning:
97.682
Minimum:
91.323
jan 1, 2012
Maximum:
111.751
jan 1, 2016
At the date of observation
Value
Absolute change
Change from the previous value
jan 1, 2001
100.0
+100.0
0.0%
jan 1, 2002
97.847
-2.153
-2.15%
jan 1, 2003
97.877
+0.029
0.03%
jan 1, 2004
96.476
-1.401
-1.43%
jan 1, 2005
94.572
-1.904
-1.97%
jan 1, 2006
95.195
+0.623
0.66%
jan 1, 2007
93.762
-1.434
-1.51%
jan 1, 2008
91.679
-2.083
-2.22%
jan 1, 2009
92.945
+1.266
1.38%
jan 1, 2010
101.621
+8.676
9.33%
jan 1, 2011
98.147
-3.474
-3.42%
jan 1, 2012
91.323
-6.824
-6.95%
jan 1, 2013
97.671
+6.348
6.95%
jan 1, 2014
100.613
+2.941
3.01%
jan 1, 2015
101.432
+0.82
0.81%
jan 1, 2016
111.751
+10.318
10.17%
Ranking of countries by current statistics by years