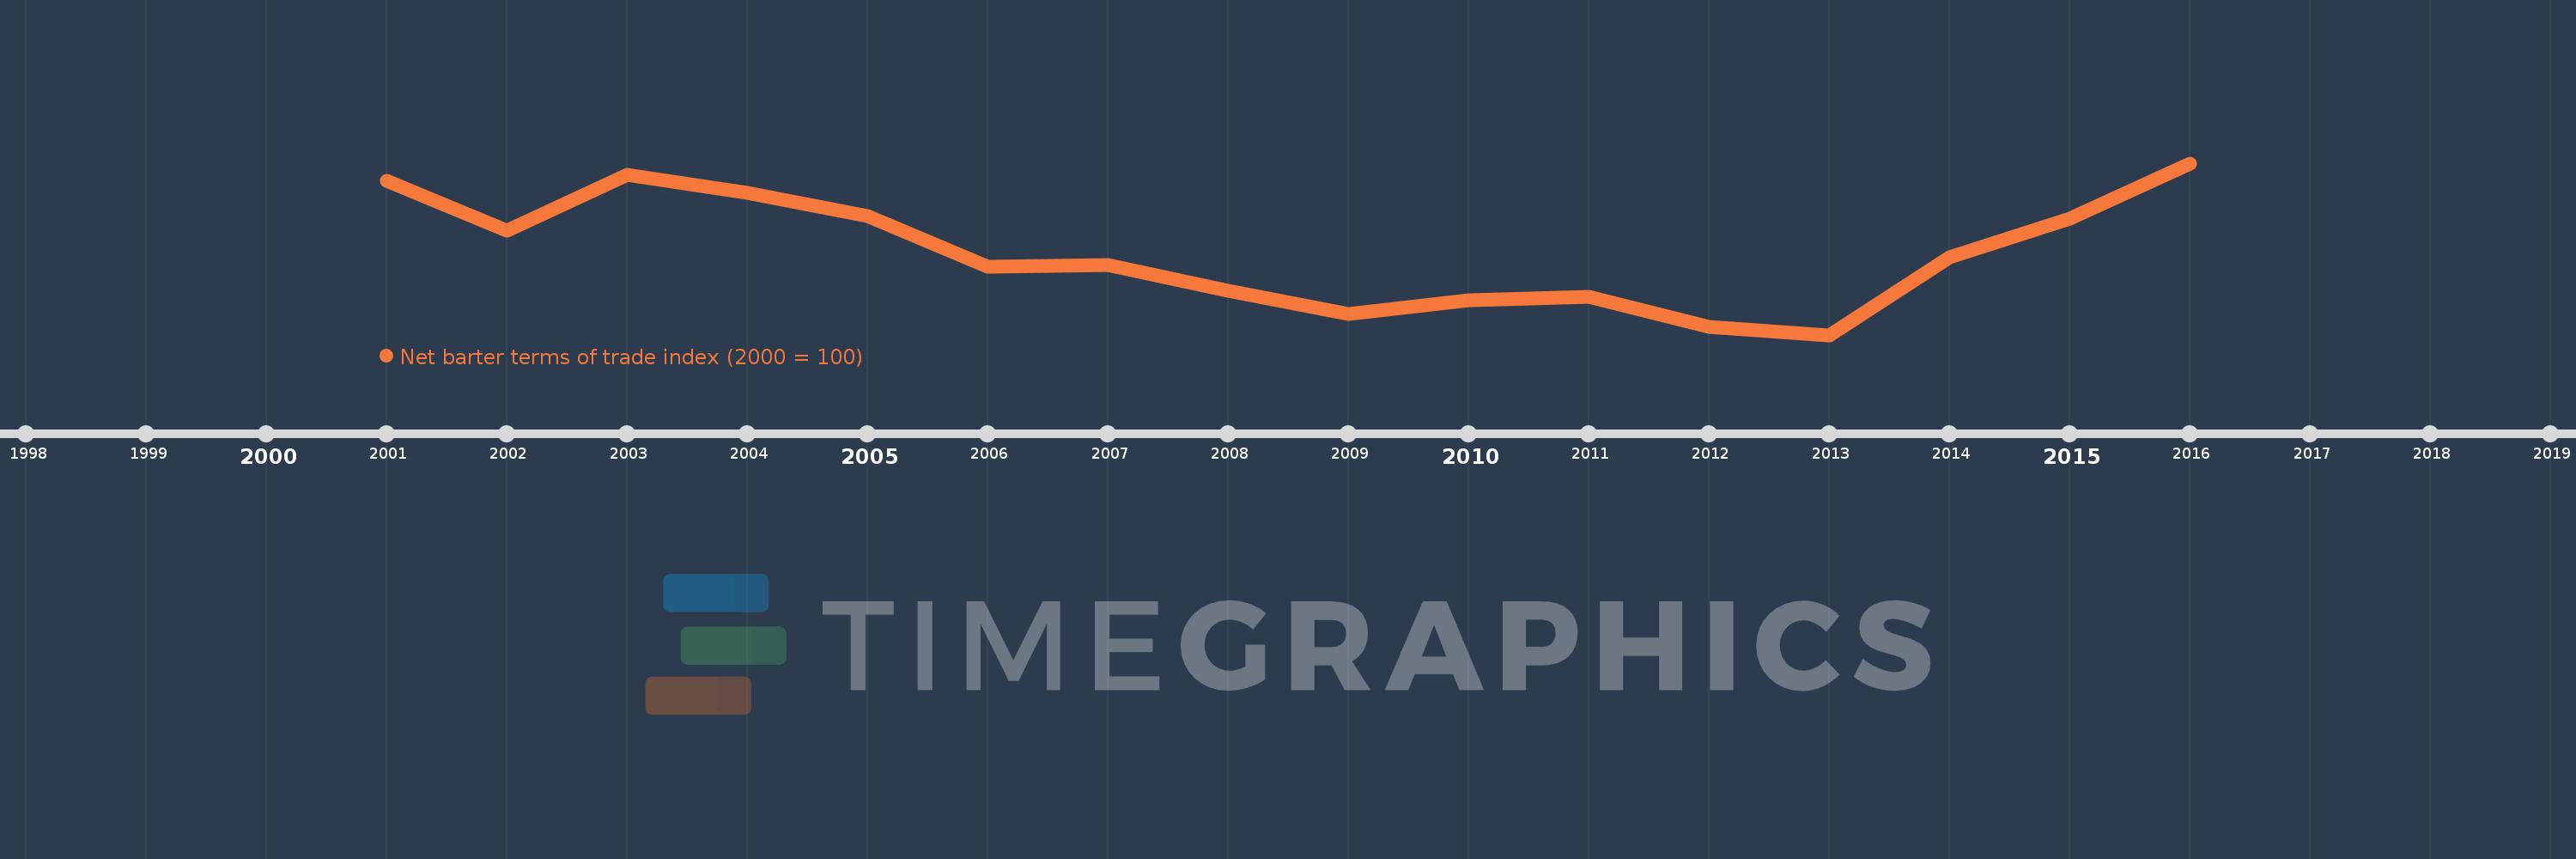
This timeline shows a graph from 2001 to 2016 of Vanuatu. No data until 2000. Number of actual observations by date: 16.
Source name:
World Development Indicators
Source organization:
United Nations Conference on Trade and Development, Handbook of Statistics and data files, and International Monetary Fund, International Financial Statistics.
Categories, topics:
Private Sector, Trade
Last updated:
apr 23, 2017
Indicators value changes by year
Meaning:
91.403
Minimum:
81.363
jan 1, 2013
Maximum:
102.098
jan 1, 2016
At the date of observation
Value
Absolute change
Change from the previous value
jan 1, 2001
100.0
+100.0
0.0%
jan 1, 2002
93.931
-6.069
-6.07%
jan 1, 2003
100.729
+6.798
7.24%
jan 1, 2004
98.485
-2.244
-2.23%
jan 1, 2005
95.678
-2.807
-2.85%
jan 1, 2006
89.626
-6.052
-6.33%
jan 1, 2007
89.838
+0.211
0.24%
jan 1, 2008
86.74
-3.098
-3.45%
jan 1, 2009
83.878
-2.861
-3.3%
jan 1, 2010
85.569
+1.691
2.02%
jan 1, 2011
86.013
+0.443
0.52%
jan 1, 2012
82.332
-3.681
-4.28%
jan 1, 2013
81.363
-0.969
-1.18%
jan 1, 2014
90.725
+9.362
11.51%
jan 1, 2015
95.44
+4.715
5.2%
jan 1, 2016
102.098
+6.658
6.98%
Ranking of countries by current statistics by years