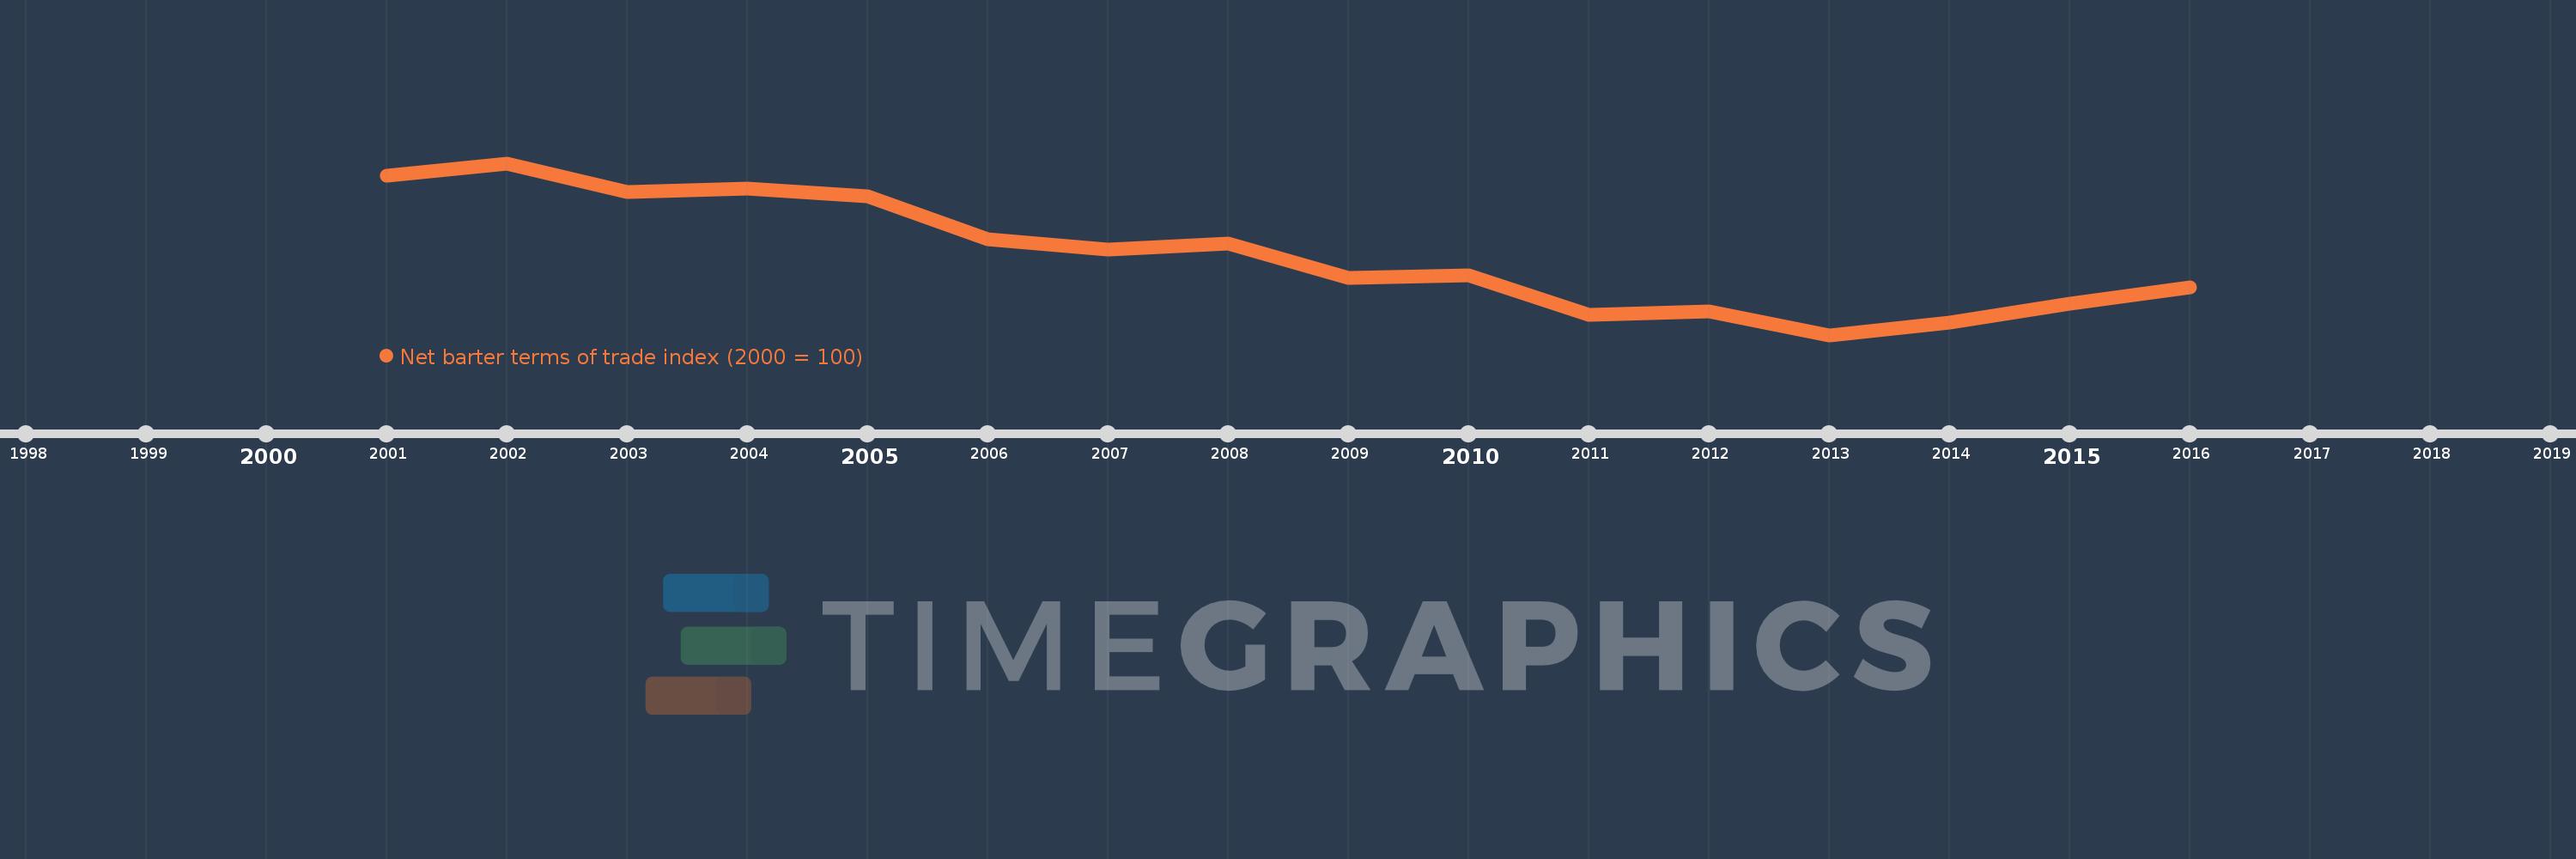
This timeline shows a graph from 2001 to 2016 of Netherlands. No data until 2000. Number of actual observations by date: 16.
Source name:
World Development Indicators
Source organization:
United Nations Conference on Trade and Development, Handbook of Statistics and data files, and International Monetary Fund, International Financial Statistics.
Categories, topics:
Private Sector, Trade
Last updated:
apr 23, 2017
Indicators value changes by year
Meaning:
95.329
Minimum:
90.568
jan 1, 2013
Maximum:
100.762
jan 1, 2002
At the date of observation
Value
Absolute change
Change from the previous value
jan 1, 2001
100.0
+100.0
0.0%
jan 1, 2002
100.762
+0.762
0.76%
jan 1, 2003
99.056
-1.706
-1.69%
jan 1, 2004
99.27
+0.214
0.22%
jan 1, 2005
98.802
-0.468
-0.47%
jan 1, 2006
96.226
-2.577
-2.61%
jan 1, 2007
95.653
-0.573
-0.6%
jan 1, 2008
95.977
+0.324
0.34%
jan 1, 2009
93.941
-2.036
-2.12%
jan 1, 2010
94.128
+0.188
0.2%
jan 1, 2011
91.778
-2.351
-2.5%
jan 1, 2012
91.946
+0.168
0.18%
jan 1, 2013
90.568
-1.378
-1.5%
jan 1, 2014
91.283
+0.715
0.79%
jan 1, 2015
92.451
+1.167
1.28%
jan 1, 2016
93.421
+0.971
1.05%
Ranking of countries by current statistics by years