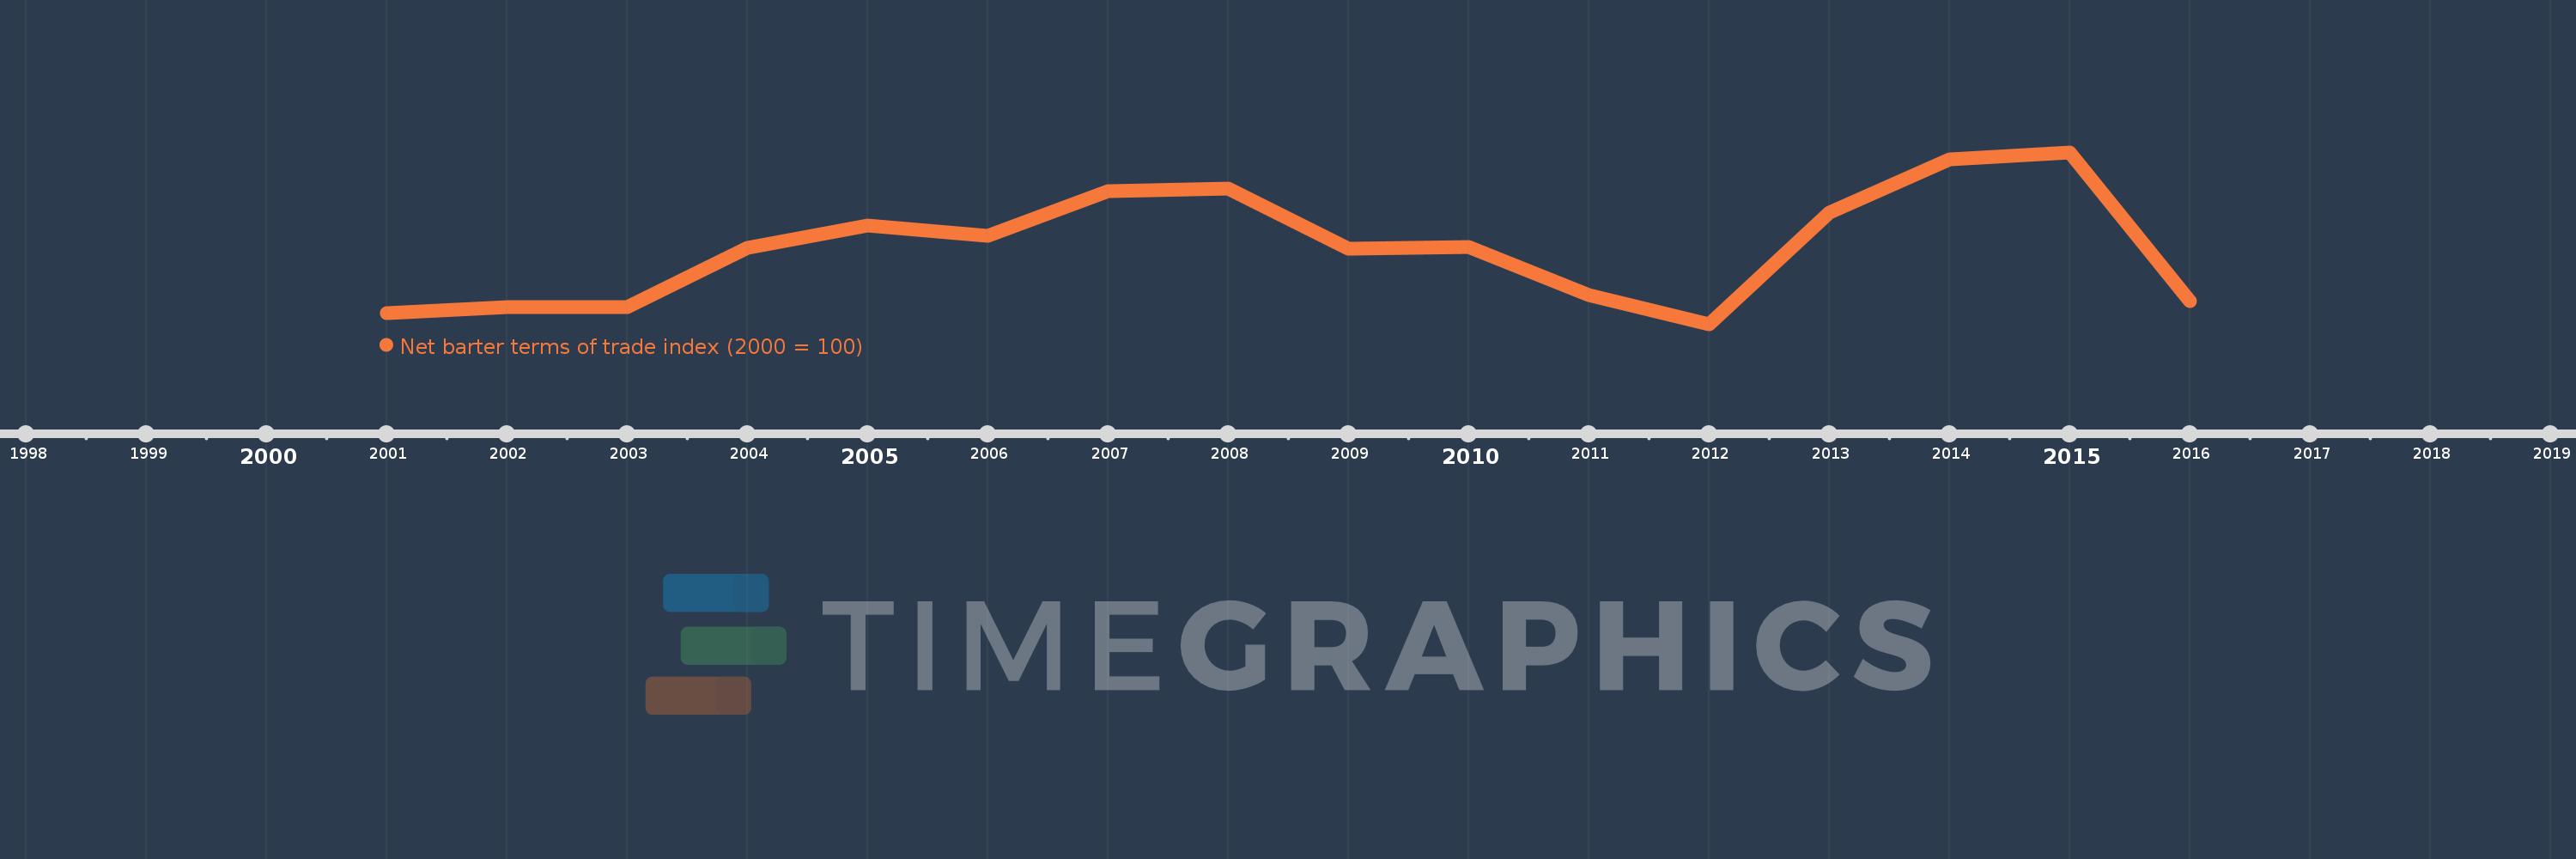
This timeline shows a graph from 2001 to 2016 of Somalia. No data until 2000. Number of actual observations by date: 16.
Source name:
World Development Indicators
Source organization:
United Nations Conference on Trade and Development, Handbook of Statistics and data files, and International Monetary Fund, International Financial Statistics.
Categories, topics:
Private Sector, Trade
Last updated:
apr 23, 2017
Indicators value changes by year
Meaning:
104.227
Minimum:
99.294
jan 1, 2012
Maximum:
110.32
jan 1, 2015
At the date of observation
Value
Absolute change
Change from the previous value
jan 1, 2001
100.0
+100.0
0.0%
jan 1, 2002
100.381
+0.381
0.38%
jan 1, 2003
100.371
-0.011
-0.01%
jan 1, 2004
104.194
+3.824
3.81%
jan 1, 2005
105.656
+1.462
1.4%
jan 1, 2006
104.961
-0.695
-0.66%
jan 1, 2007
107.811
+2.85
2.72%
jan 1, 2008
108.012
+0.201
0.19%
jan 1, 2009
104.159
-3.853
-3.57%
jan 1, 2010
104.228
+0.069
0.07%
jan 1, 2011
101.145
-3.084
-2.96%
jan 1, 2012
99.294
-1.851
-1.83%
jan 1, 2013
106.449
+7.155
7.21%
jan 1, 2014
109.858
+3.409
3.2%
jan 1, 2015
110.32
+0.461
0.42%
jan 1, 2016
100.798
-9.522
-8.63%
Ranking of countries by current statistics by years