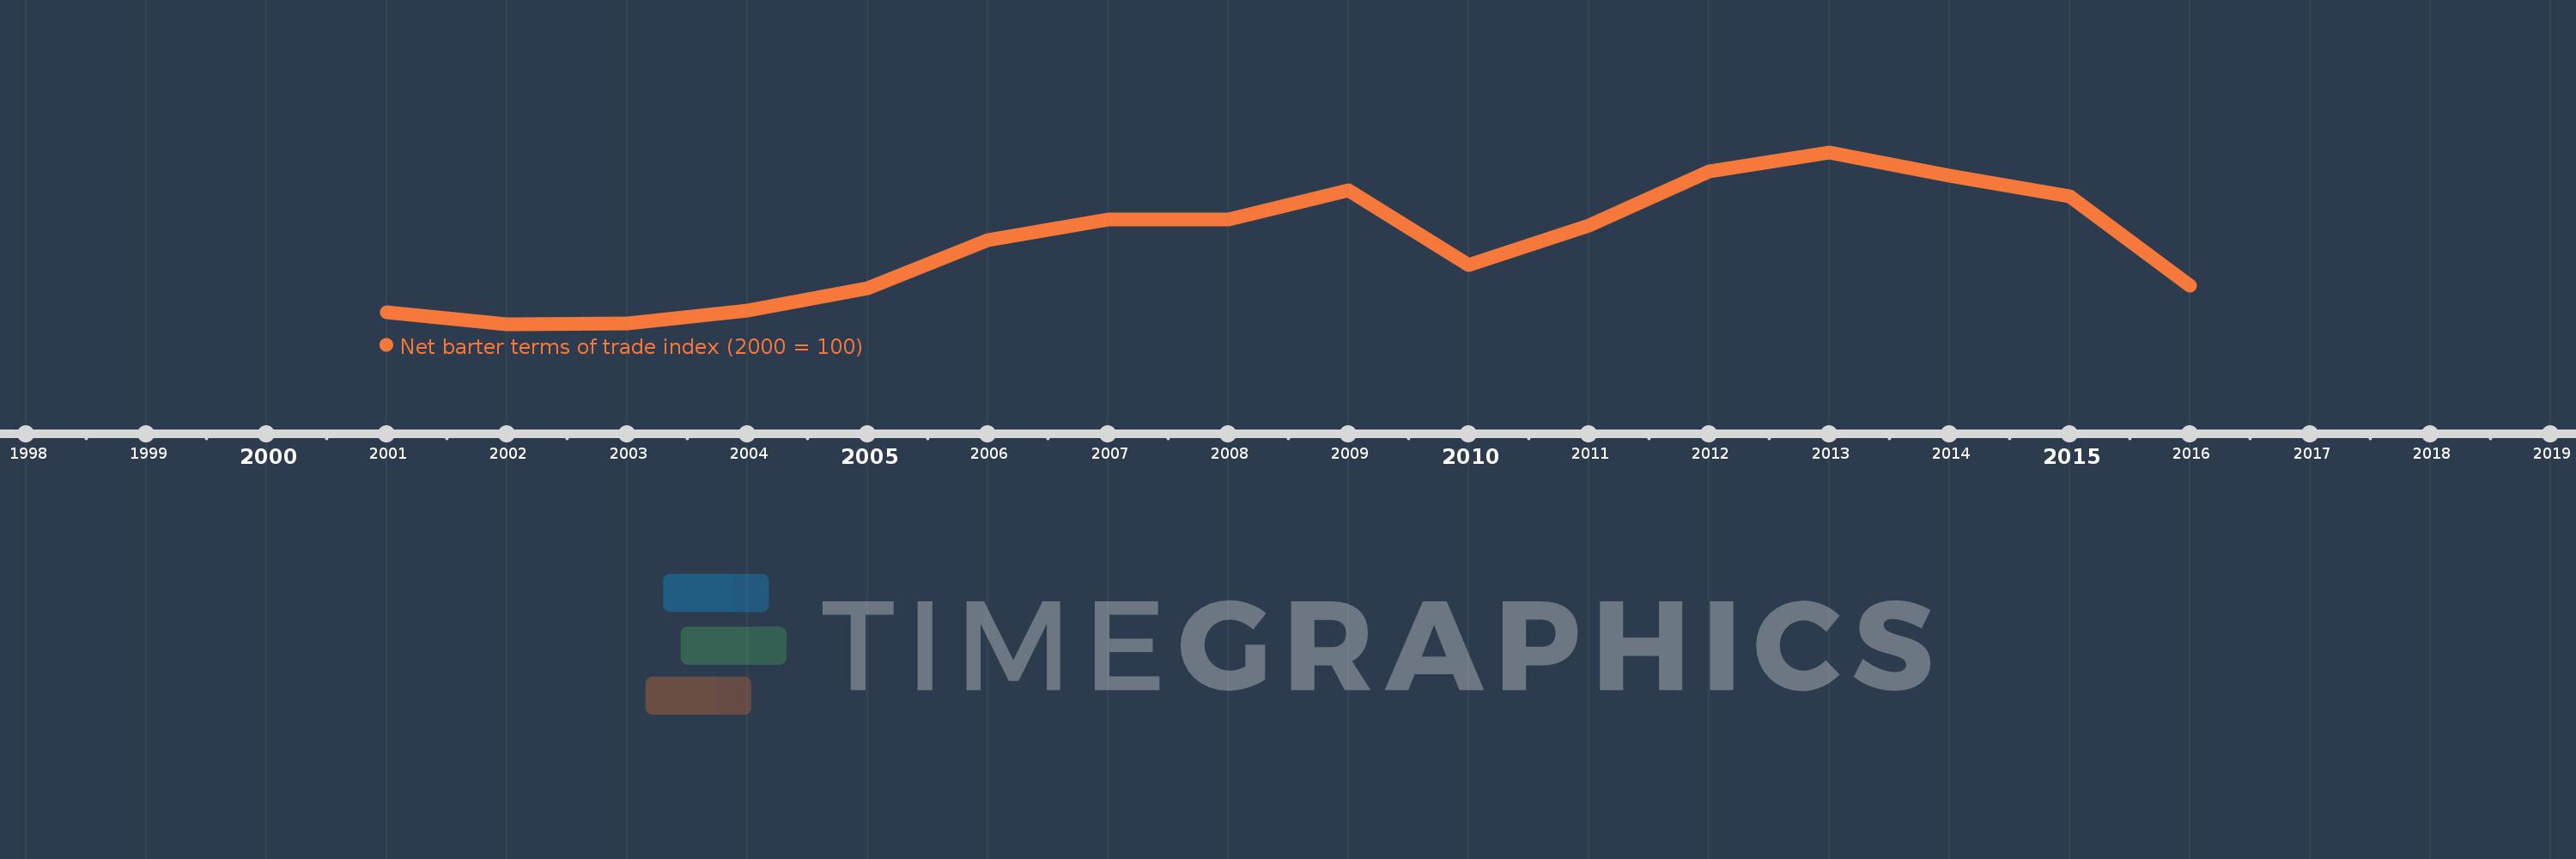
This timeline shows a graph from 2001 to 2016 of Saudi Arabia. No data until 2000. Number of actual observations by date: 16.
Source name:
World Development Indicators
Source organization:
United Nations Conference on Trade and Development, Handbook of Statistics and data files, and International Monetary Fund, International Financial Statistics.
Categories, topics:
Private Sector, Trade
Last updated:
apr 23, 2017
Indicators value changes by year
Meaning:
154.936
Minimum:
90.111
jan 1, 2002
Maximum:
228.571
jan 1, 2013
At the date of observation
Value
Absolute change
Change from the previous value
jan 1, 2001
100.0
+100.0
0.0%
jan 1, 2002
90.111
-9.889
-9.89%
jan 1, 2003
90.473
+0.362
0.4%
jan 1, 2004
101.045
+10.572
11.69%
jan 1, 2005
119.229
+18.184
18.0%
jan 1, 2006
157.598
+38.369
32.18%
jan 1, 2007
174.187
+16.589
10.53%
jan 1, 2008
174.645
+0.458
0.26%
jan 1, 2009
197.878
+23.233
13.3%
jan 1, 2010
138.016
-59.862
-30.25%
jan 1, 2011
169.694
+31.678
22.95%
jan 1, 2012
213.258
+43.564
25.67%
jan 1, 2013
228.571
+15.313
7.18%
jan 1, 2014
209.946
-18.624
-8.15%
jan 1, 2015
193.201
-16.745
-7.98%
jan 1, 2016
121.117
-72.084
-37.31%
Ranking of countries by current statistics by years