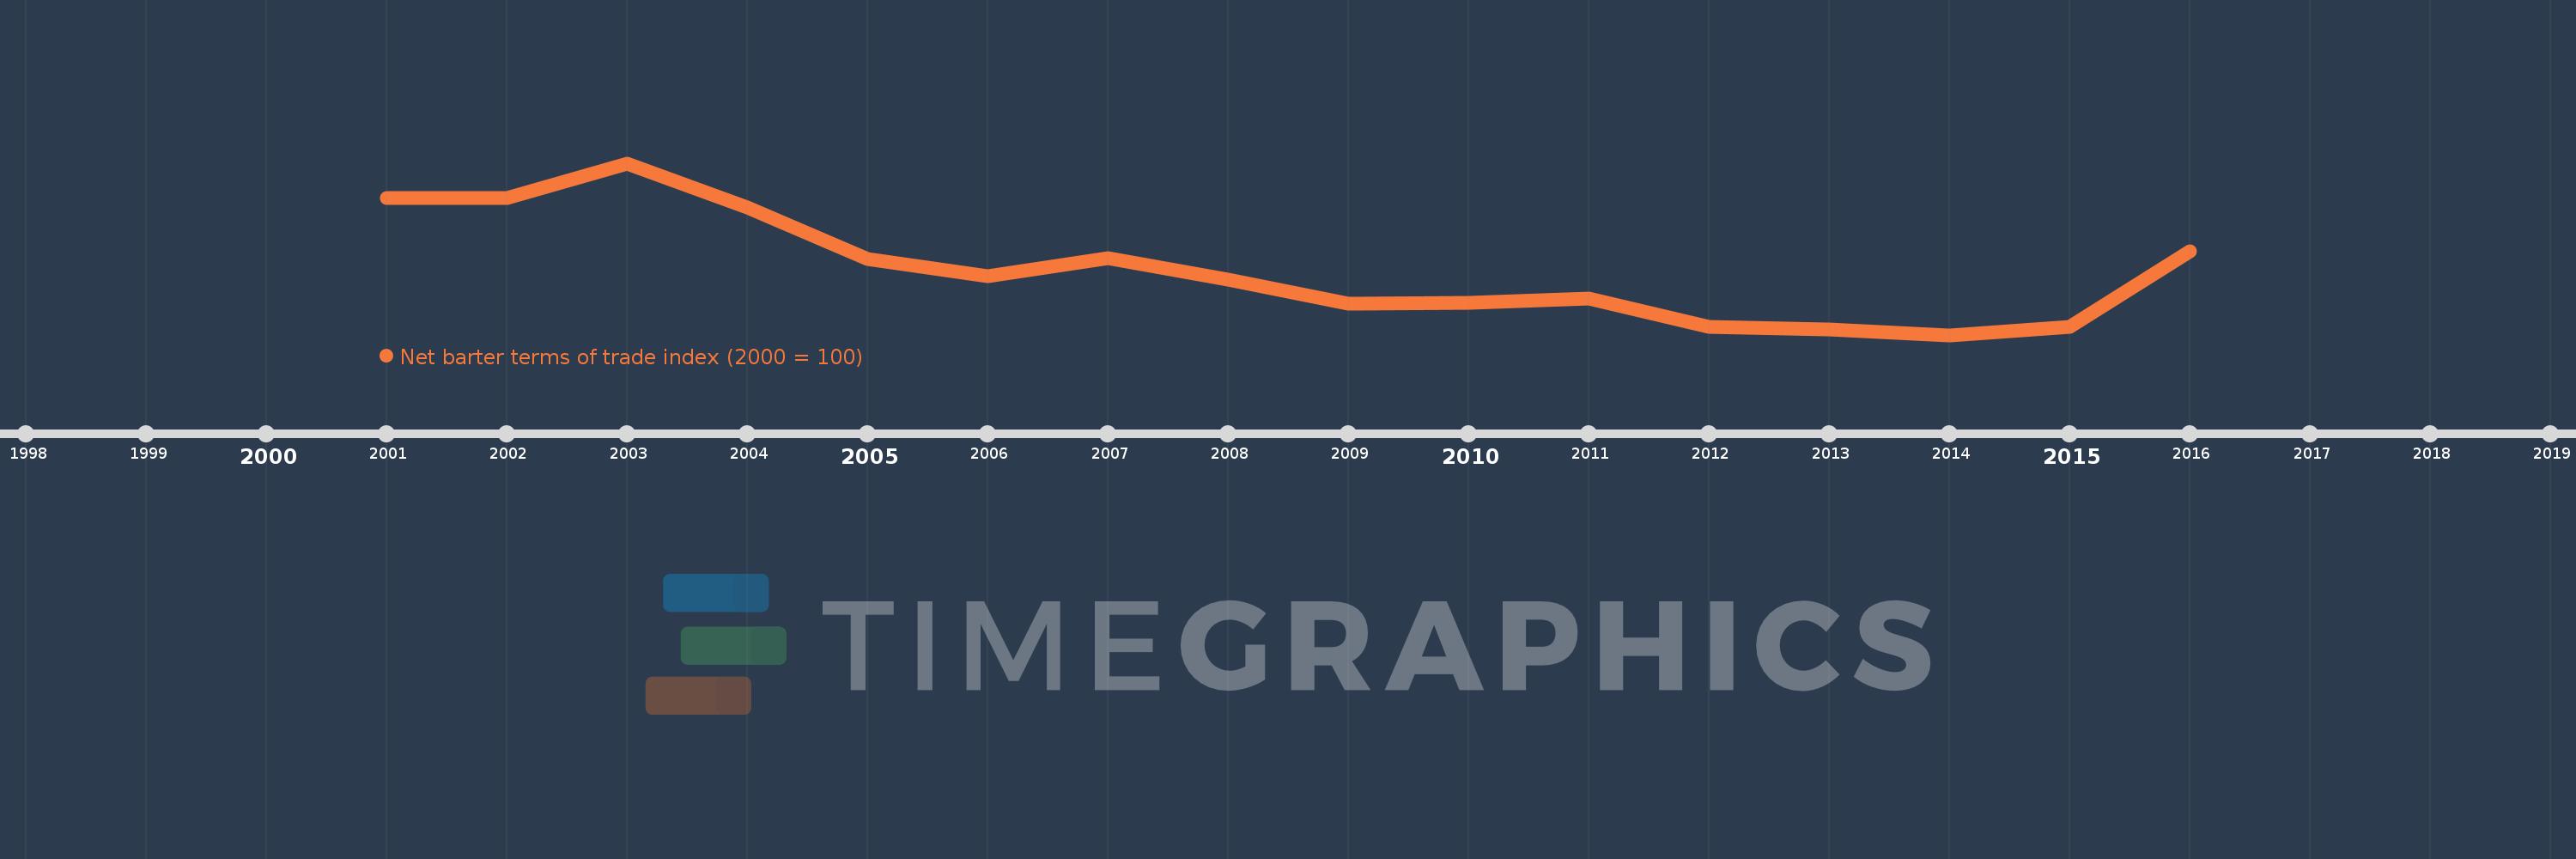
This timeline shows a graph from 2001 to 2016 of Micronesia, Fed. Sts.. No data until 2000. Number of actual observations by date: 16.
Source name:
World Development Indicators
Source organization:
United Nations Conference on Trade and Development, Handbook of Statistics and data files, and International Monetary Fund, International Financial Statistics.
Categories, topics:
Private Sector, Trade
Last updated:
apr 23, 2017
Indicators value changes by year
Meaning:
86.6
Minimum:
74.32
jan 1, 2014
Maximum:
106.582
jan 1, 2003
At the date of observation
Value
Absolute change
Change from the previous value
jan 1, 2001
100.0
+100.0
0.0%
jan 1, 2002
100.053
+0.053
0.05%
jan 1, 2003
106.582
+6.529
6.53%
jan 1, 2004
98.328
-8.254
-7.74%
jan 1, 2005
88.573
-9.754
-9.92%
jan 1, 2006
85.326
-3.247
-3.67%
jan 1, 2007
88.78
+3.453
4.05%
jan 1, 2008
84.675
-4.105
-4.62%
jan 1, 2009
80.219
-4.456
-5.26%
jan 1, 2010
80.346
+0.127
0.16%
jan 1, 2011
81.245
+0.899
1.12%
jan 1, 2012
75.889
-5.356
-6.59%
jan 1, 2013
75.36
-0.529
-0.7%
jan 1, 2014
74.32
-1.04
-1.38%
jan 1, 2015
75.914
+1.595
2.15%
jan 1, 2016
89.988
+14.073
18.54%
Ranking of countries by current statistics by years