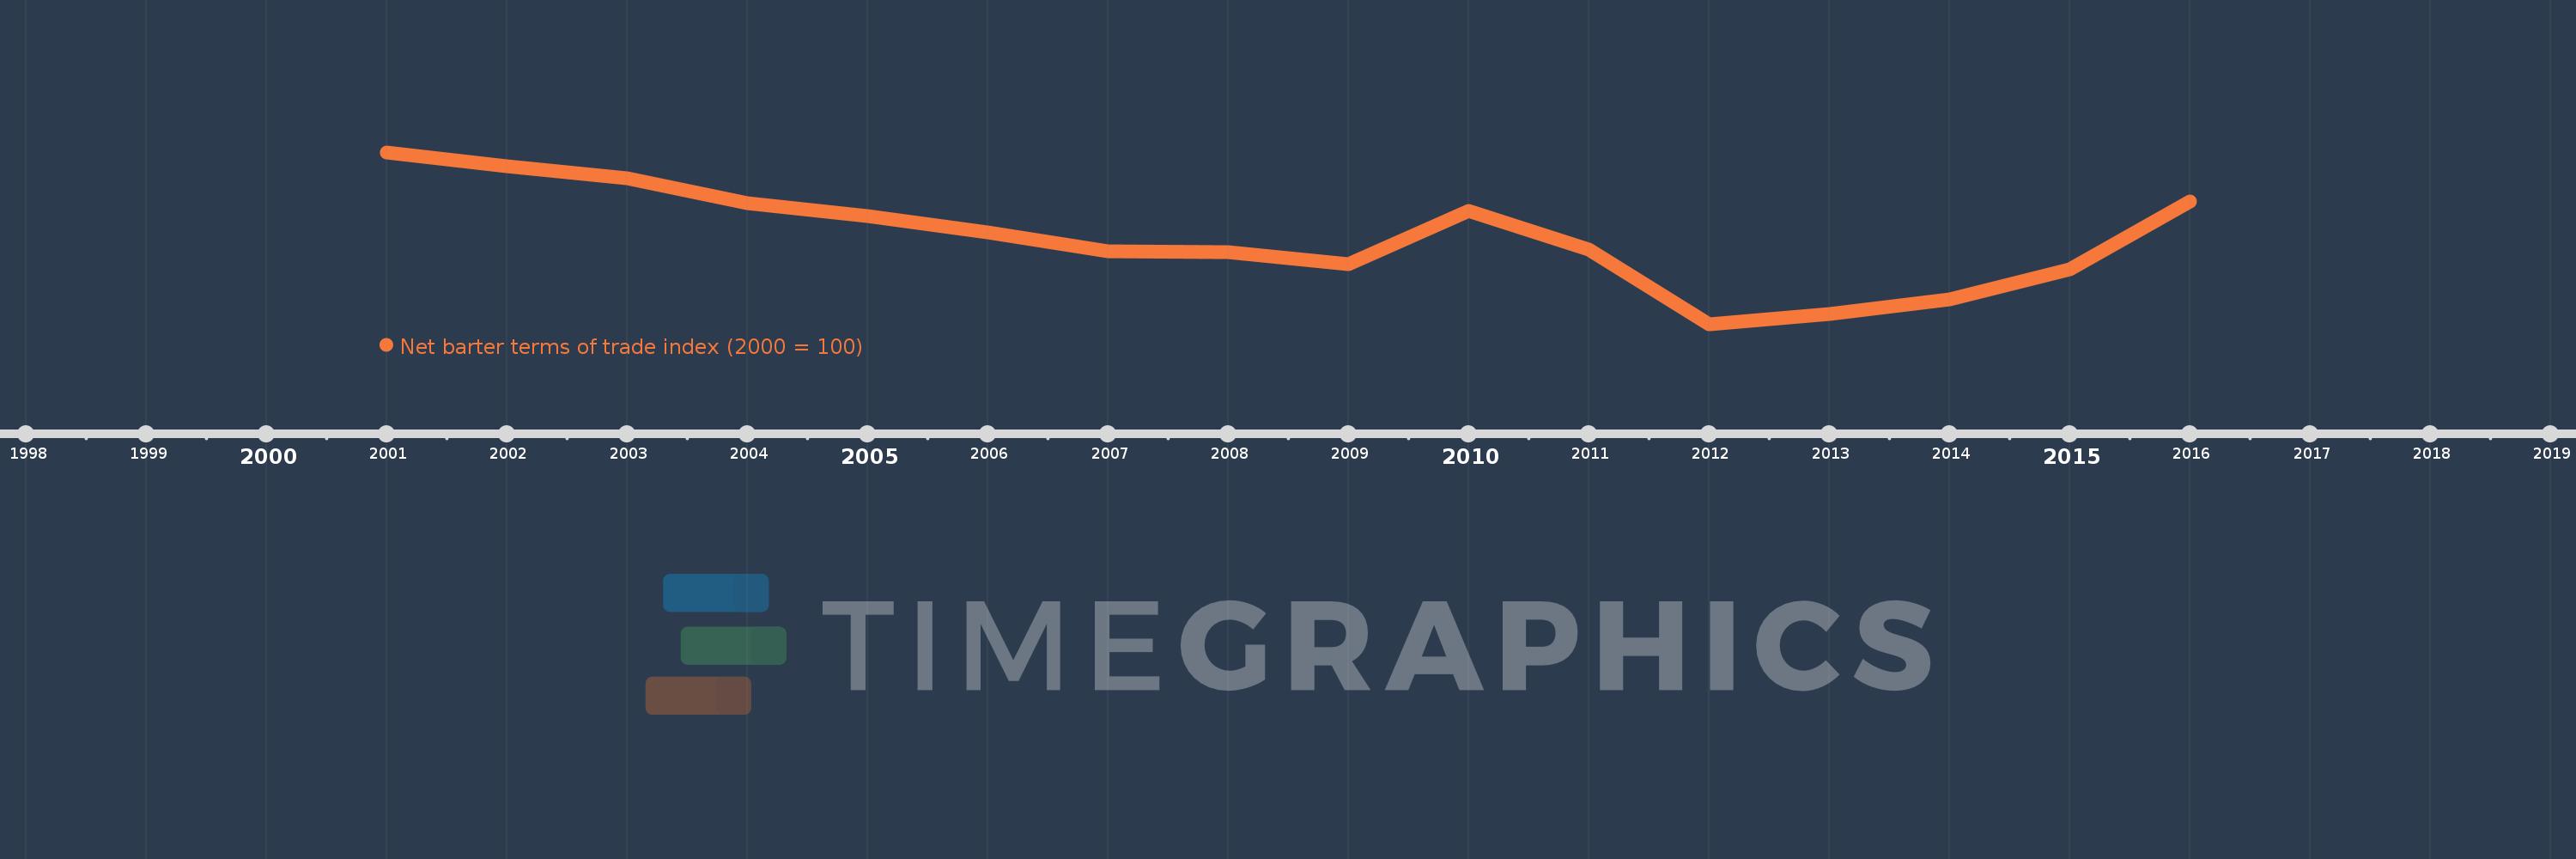
This timeline shows a graph from 2001 to 2016 of Macedonia, FYR. No data until 2000. Number of actual observations by date: 16.
Source name:
World Development Indicators
Source organization:
United Nations Conference on Trade and Development, Handbook of Statistics and data files, and International Monetary Fund, International Financial Statistics.
Categories, topics:
Private Sector, Trade
Last updated:
apr 23, 2017
Indicators value changes by year
Meaning:
93.406
Minimum:
86.532
jan 1, 2012
Maximum:
100.0
jan 1, 2001
At the date of observation
Value
Absolute change
Change from the previous value
jan 1, 2001
100.0
+100.0
0.0%
jan 1, 2002
98.922
-1.078
-1.08%
jan 1, 2003
98.004
-0.918
-0.93%
jan 1, 2004
96.026
-1.977
-2.02%
jan 1, 2005
94.984
-1.042
-1.09%
jan 1, 2006
93.738
-1.246
-1.31%
jan 1, 2007
92.253
-1.485
-1.58%
jan 1, 2008
92.168
-0.085
-0.09%
jan 1, 2009
91.217
-0.95
-1.03%
jan 1, 2010
95.432
+4.214
4.62%
jan 1, 2011
92.394
-3.038
-3.18%
jan 1, 2012
86.532
-5.862
-6.34%
jan 1, 2013
87.348
+0.816
0.94%
jan 1, 2014
88.465
+1.117
1.28%
jan 1, 2015
90.84
+2.375
2.68%
jan 1, 2016
96.17
+5.33
5.87%
Ranking of countries by current statistics by years