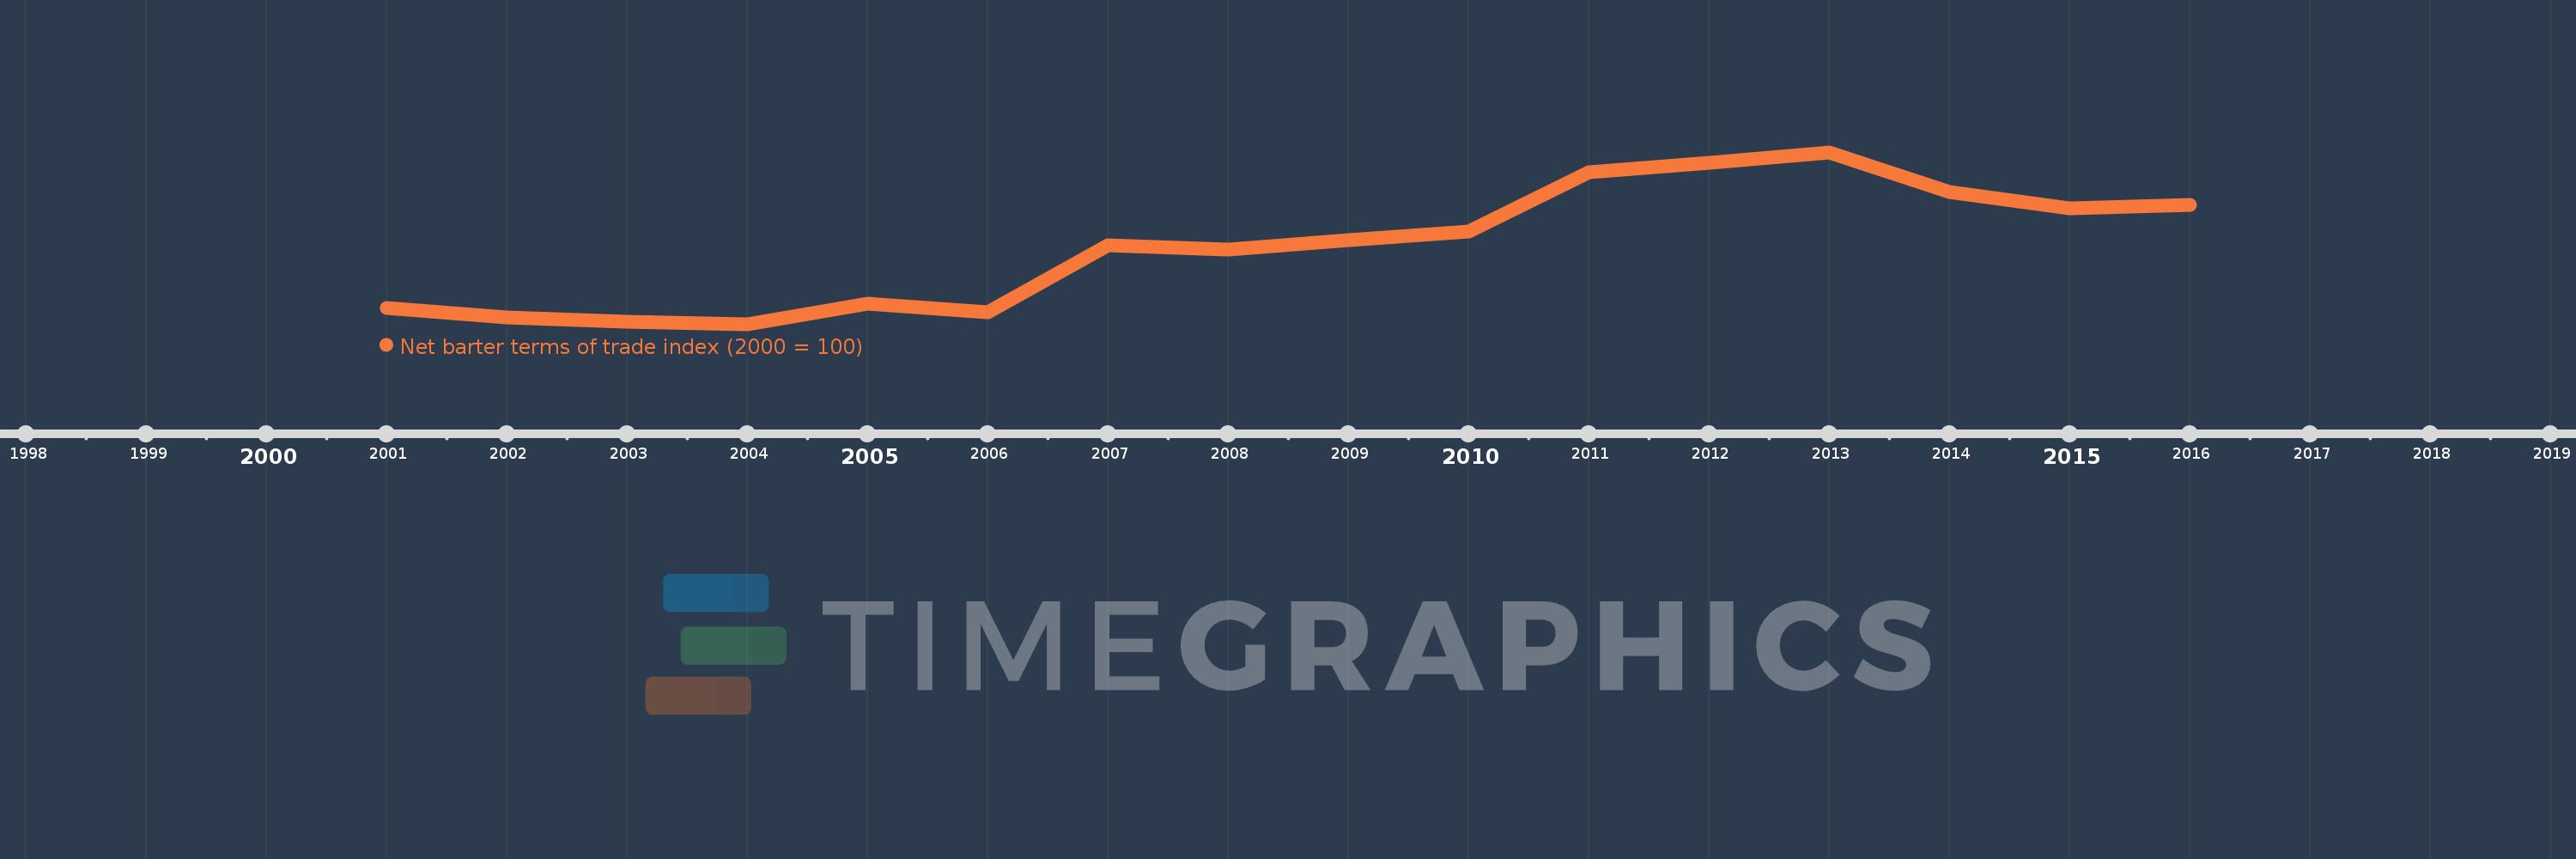
This timeline shows a graph from 2001 to 2016 of Suriname. No data until 2000. Number of actual observations by date: 16.
Source name:
World Development Indicators
Source organization:
United Nations Conference on Trade and Development, Handbook of Statistics and data files, and International Monetary Fund, International Financial Statistics.
Categories, topics:
Private Sector, Trade
Last updated:
apr 23, 2017
Indicators value changes by year
Meaning:
118.275
Minimum:
95.171
jan 1, 2004
Maximum:
146.349
jan 1, 2013
At the date of observation
Value
Absolute change
Change from the previous value
jan 1, 2001
100.0
+100.0
0.0%
jan 1, 2002
97.317
-2.683
-2.68%
jan 1, 2003
95.796
-1.521
-1.56%
jan 1, 2004
95.171
-0.626
-0.65%
jan 1, 2005
101.326
+6.156
6.47%
jan 1, 2006
98.833
-2.494
-2.46%
jan 1, 2007
118.574
+19.741
19.97%
jan 1, 2008
117.47
-1.103
-0.93%
jan 1, 2009
120.123
+2.653
2.26%
jan 1, 2010
122.872
+2.749
2.29%
jan 1, 2011
140.482
+17.61
14.33%
jan 1, 2012
143.153
+2.67
1.9%
jan 1, 2013
146.349
+3.196
2.23%
jan 1, 2014
134.533
-11.816
-8.07%
jan 1, 2015
129.611
-4.921
-3.66%
jan 1, 2016
130.786
+1.175
0.91%
Ranking of countries by current statistics by years