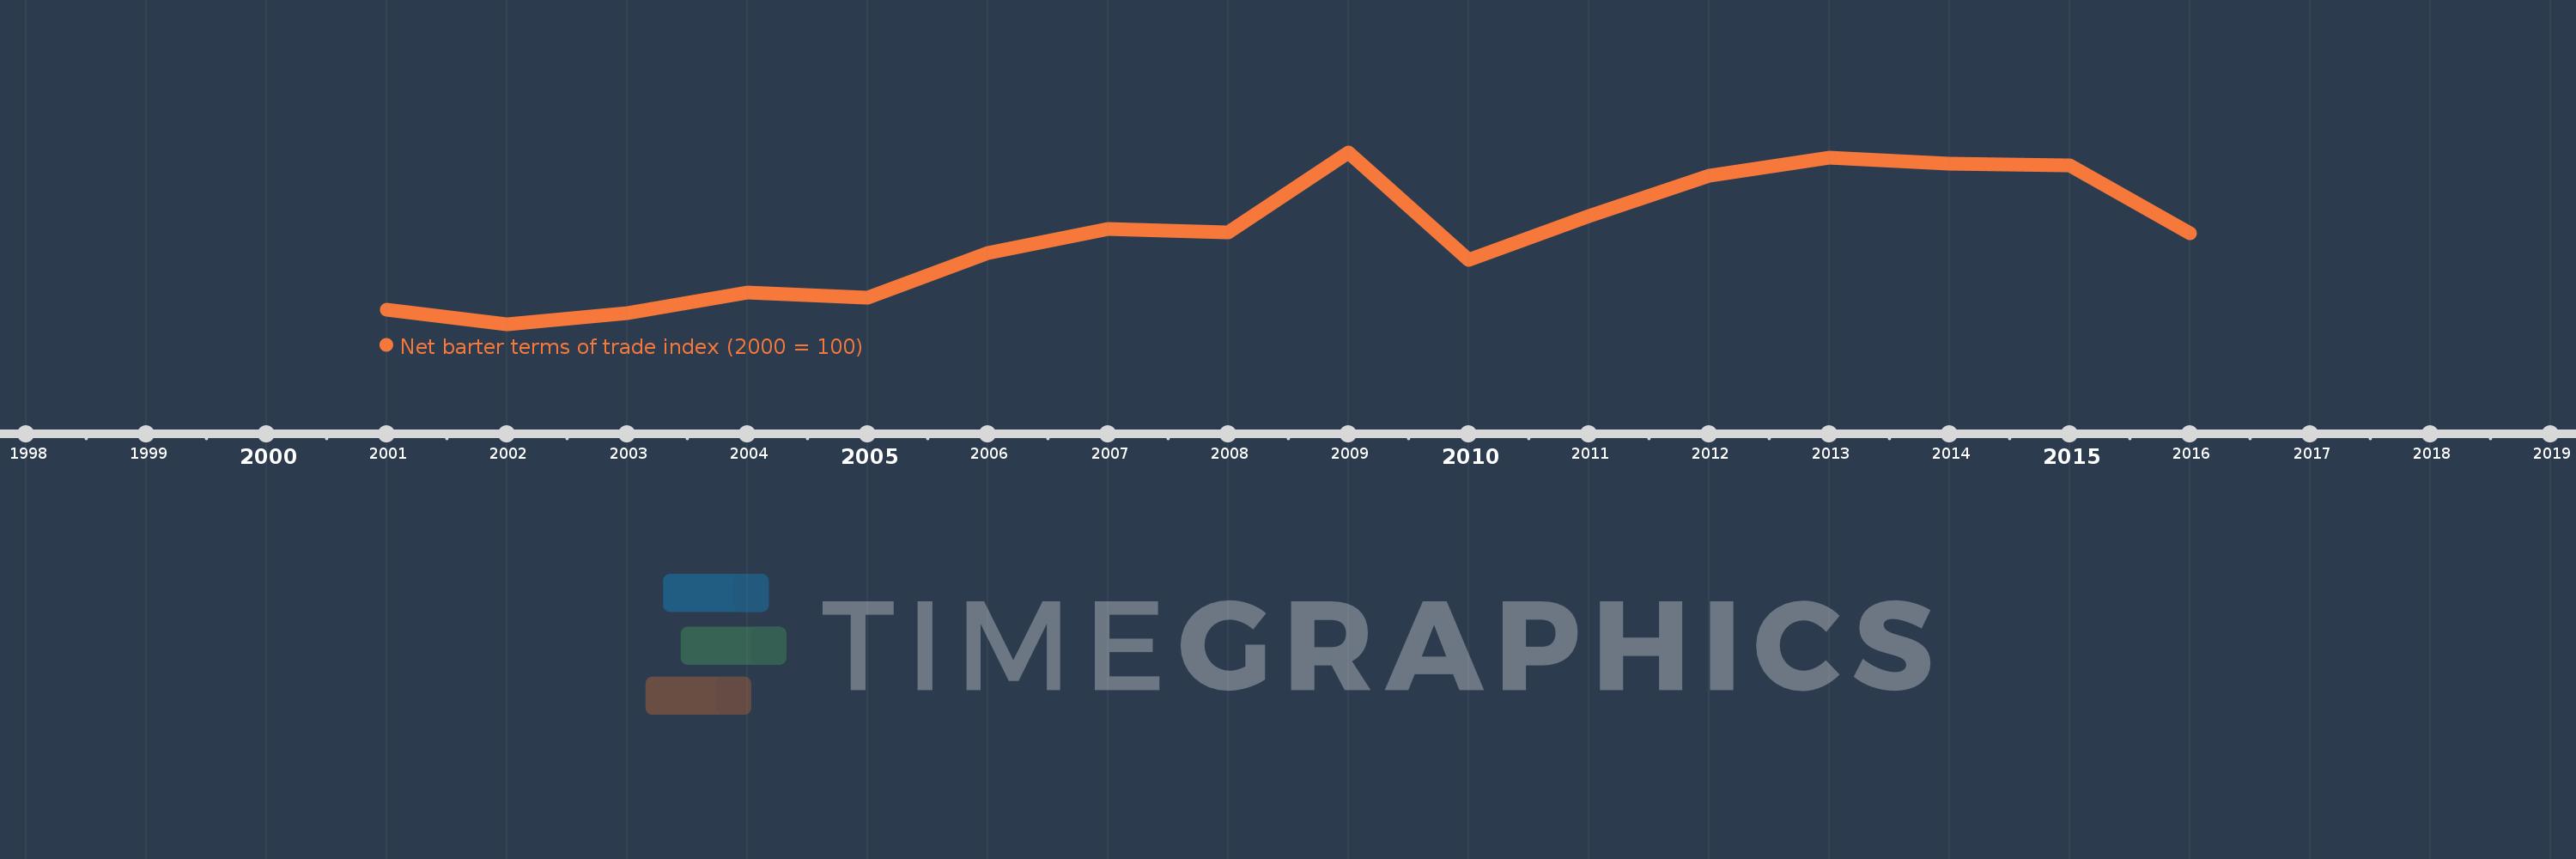
This timeline shows a graph from 2001 to 2016 of Oman. No data until 2000. Number of actual observations by date: 16.
Source name:
World Development Indicators
Source organization:
United Nations Conference on Trade and Development, Handbook of Statistics and data files, and International Monetary Fund, International Financial Statistics.
Categories, topics:
Private Sector, Trade
Last updated:
apr 23, 2017
Indicators value changes by year
Meaning:
172.25
Minimum:
86.272
jan 1, 2002
Maximum:
253.54
jan 1, 2009
At the date of observation
Value
Absolute change
Change from the previous value
jan 1, 2001
100.0
+100.0
0.0%
jan 1, 2002
86.272
-13.728
-13.73%
jan 1, 2003
97.339
+11.067
12.83%
jan 1, 2004
117.36
+20.02
20.57%
jan 1, 2005
112.073
-5.287
-4.5%
jan 1, 2006
155.59
+43.517
38.83%
jan 1, 2007
179.164
+23.574
15.15%
jan 1, 2008
176.081
-3.084
-1.72%
jan 1, 2009
253.54
+77.459
43.99%
jan 1, 2010
148.533
-105.007
-41.42%
jan 1, 2011
191.921
+43.388
29.21%
jan 1, 2012
230.551
+38.63
20.13%
jan 1, 2013
248.671
+18.12
7.86%
jan 1, 2014
242.683
-5.987
-2.41%
jan 1, 2015
241.242
-1.441
-0.59%
jan 1, 2016
174.977
-66.265
-27.47%
Ranking of countries by current statistics by years