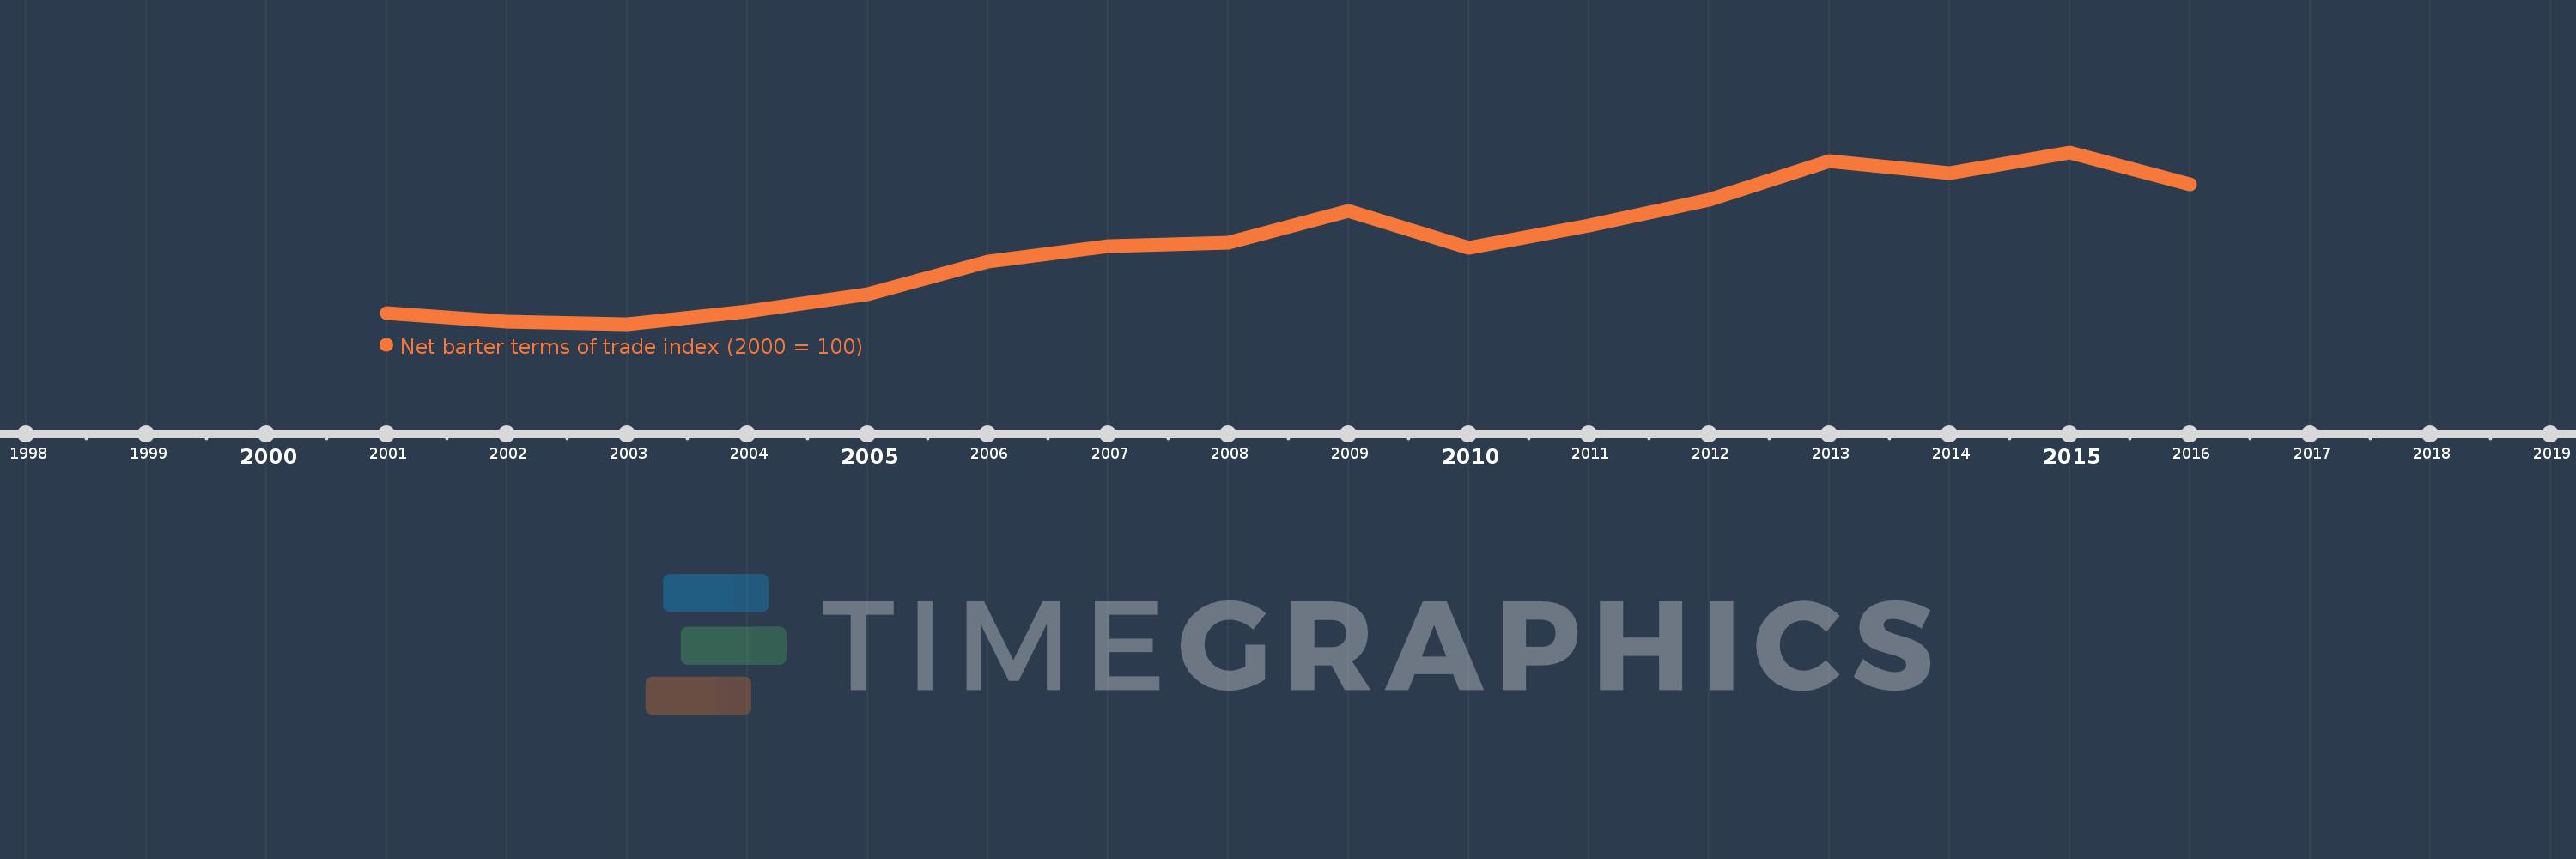
This timeline shows a graph from 2001 to 2016 of United Arab Emirates. No data until 2000. Number of actual observations by date: 16.
Source name:
World Development Indicators
Source organization:
United Nations Conference on Trade and Development, Handbook of Statistics and data files, and International Monetary Fund, International Financial Statistics.
Categories, topics:
Private Sector, Trade
Last updated:
apr 23, 2017
Indicators value changes by year
Meaning:
151.132
Minimum:
91.726
jan 1, 2003
Maximum:
215.877
jan 1, 2015
At the date of observation
Value
Absolute change
Change from the previous value
jan 1, 2001
100.0
+100.0
0.0%
jan 1, 2002
93.509
-6.491
-6.49%
jan 1, 2003
91.726
-1.783
-1.91%
jan 1, 2004
100.949
+9.223
10.06%
jan 1, 2005
113.157
+12.207
12.09%
jan 1, 2006
137.287
+24.131
21.33%
jan 1, 2007
148.04
+10.753
7.83%
jan 1, 2008
150.341
+2.3
1.55%
jan 1, 2009
173.339
+22.998
15.3%
jan 1, 2010
146.783
-26.556
-15.32%
jan 1, 2011
162.763
+15.979
10.89%
jan 1, 2012
181.463
+18.701
11.49%
jan 1, 2013
209.304
+27.841
15.34%
jan 1, 2014
200.938
-8.366
-4.0%
jan 1, 2015
215.877
+14.939
7.43%
jan 1, 2016
192.636
-23.241
-10.77%
Ranking of countries by current statistics by years