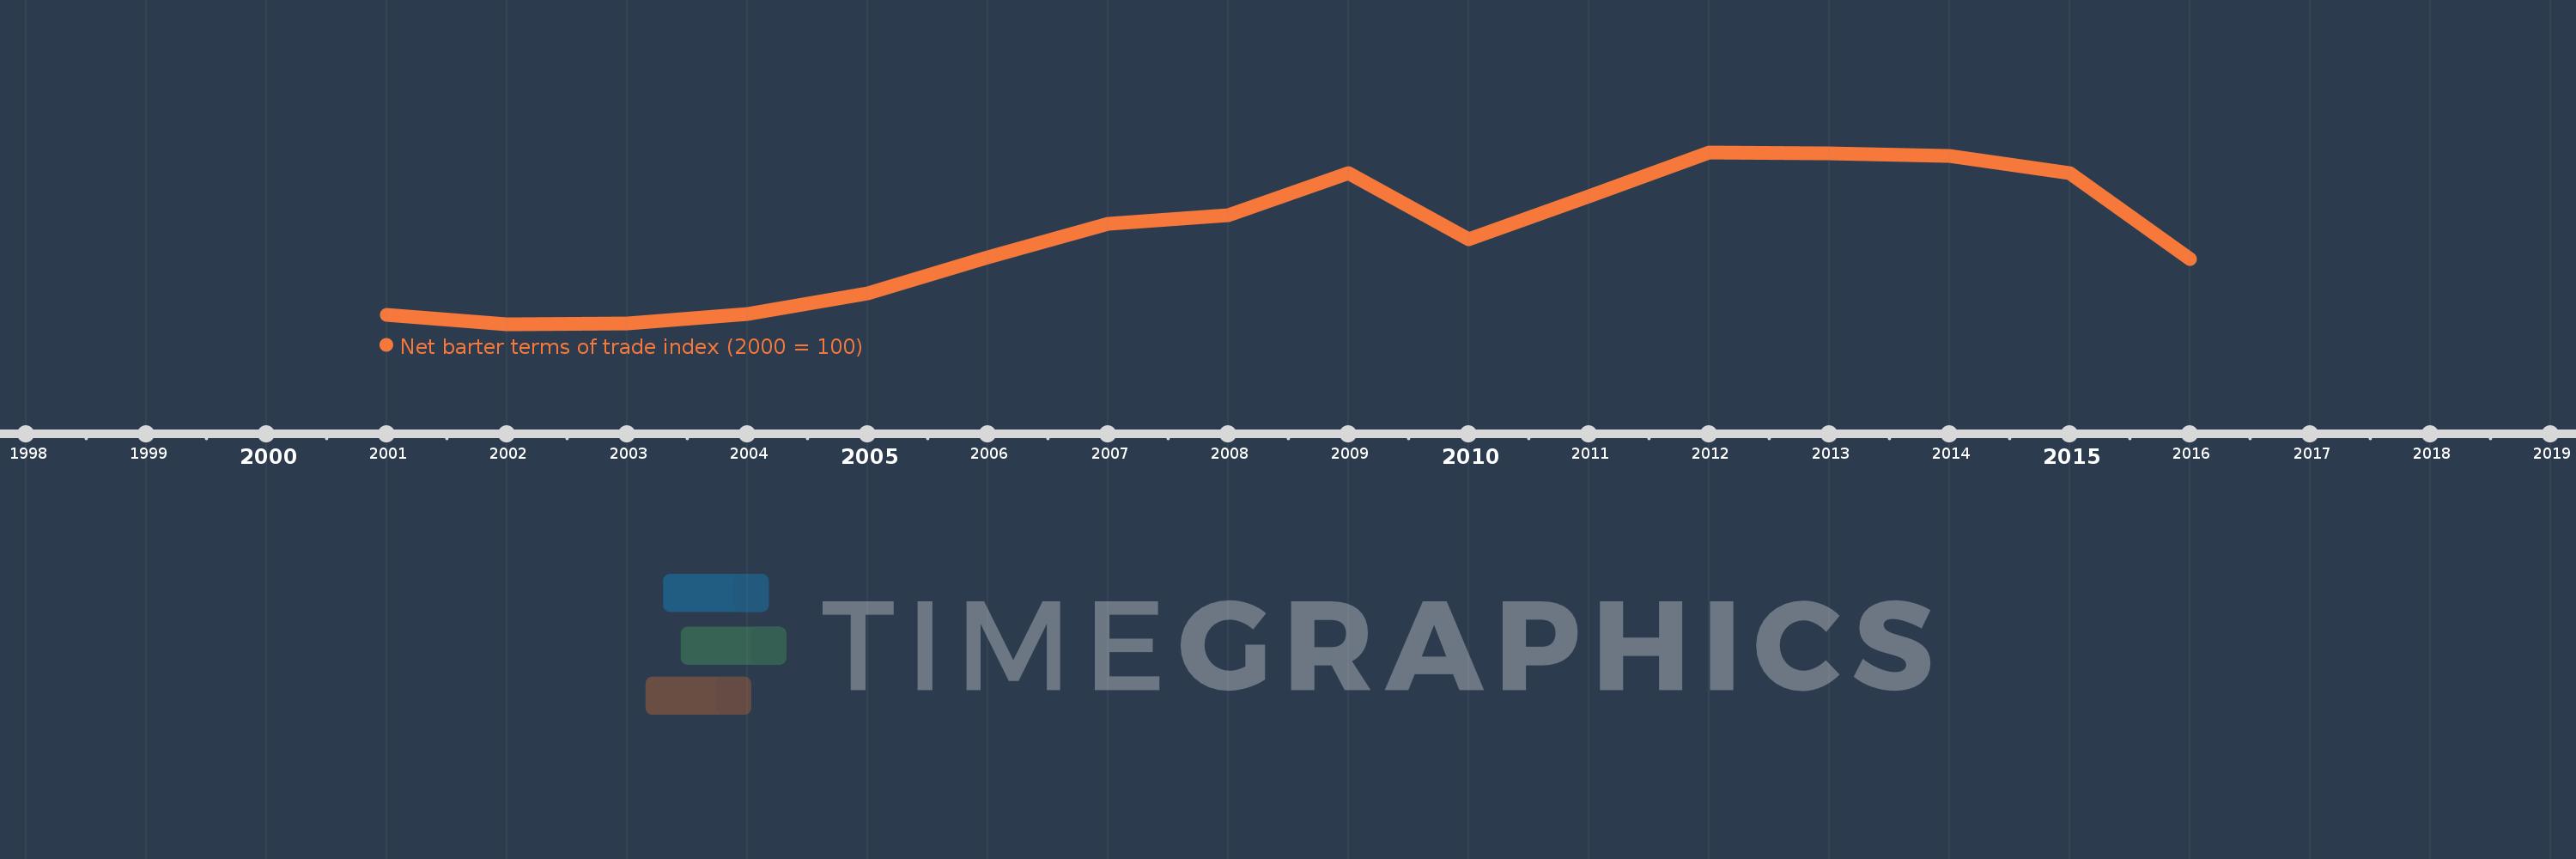
This timeline shows a graph from 2001 to 2016 of Kazakhstan. No data until 2000. Number of actual observations by date: 16.
Source name:
World Development Indicators
Source organization:
United Nations Conference on Trade and Development, Handbook of Statistics and data files, and International Monetary Fund, International Financial Statistics.
Categories, topics:
Private Sector, Trade
Last updated:
apr 23, 2017
Indicators value changes by year
Meaning:
165.081
Minimum:
92.282
jan 1, 2002
Maximum:
233.428
jan 1, 2012
At the date of observation
Value
Absolute change
Change from the previous value
jan 1, 2001
100.0
+100.0
0.0%
jan 1, 2002
92.282
-7.718
-7.72%
jan 1, 2003
92.764
+0.483
0.52%
jan 1, 2004
100.604
+7.84
8.45%
jan 1, 2005
117.837
+17.233
17.13%
jan 1, 2006
146.948
+29.111
24.7%
jan 1, 2007
174.513
+27.565
18.76%
jan 1, 2008
181.921
+7.408
4.25%
jan 1, 2009
216.525
+34.604
19.02%
jan 1, 2010
161.815
-54.71
-25.27%
jan 1, 2011
197.314
+35.499
21.94%
jan 1, 2012
233.428
+36.115
18.3%
jan 1, 2013
232.973
-0.455
-0.19%
jan 1, 2014
230.418
-2.555
-1.1%
jan 1, 2015
216.187
-14.231
-6.18%
jan 1, 2016
145.772
-70.415
-32.57%
Ranking of countries by current statistics by years