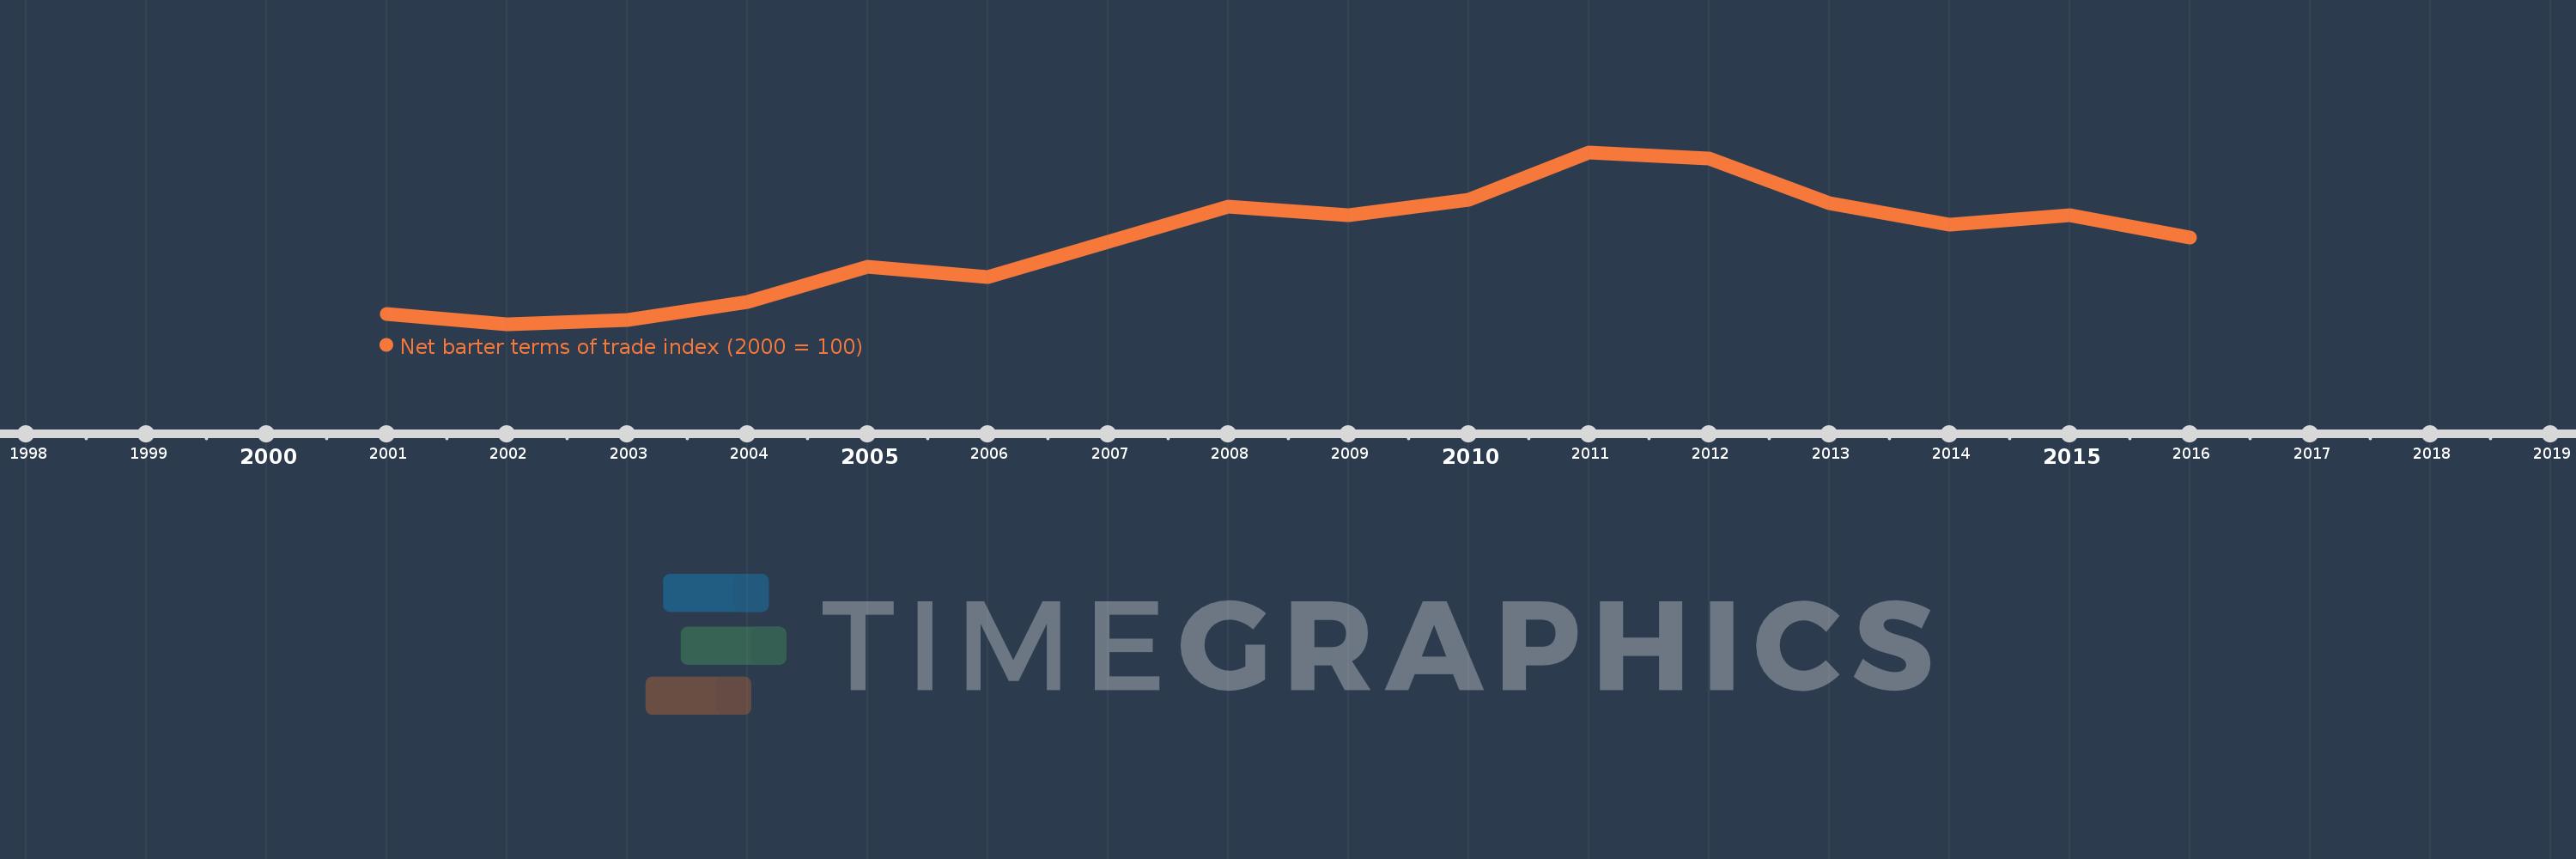
This timeline shows a graph from 2001 to 2016 of New Caledonia. No data until 2000. Number of actual observations by date: 16.
Source name:
World Development Indicators
Source organization:
United Nations Conference on Trade and Development, Handbook of Statistics and data files, and International Monetary Fund, International Financial Statistics.
Categories, topics:
Private Sector, Trade
Last updated:
apr 23, 2017
Indicators value changes by year
Meaning:
162.084
Minimum:
91.644
jan 1, 2002
Maximum:
237.408
jan 1, 2011
At the date of observation
Value
Absolute change
Change from the previous value
jan 1, 2001
100.0
+100.0
0.0%
jan 1, 2002
91.644
-8.356
-8.36%
jan 1, 2003
95.228
+3.584
3.91%
jan 1, 2004
110.372
+15.145
15.9%
jan 1, 2005
140.283
+29.911
27.1%
jan 1, 2006
131.65
-8.633
-6.15%
jan 1, 2007
161.545
+29.896
22.71%
jan 1, 2008
191.092
+29.547
18.29%
jan 1, 2009
184.256
-6.836
-3.58%
jan 1, 2010
197.348
+13.092
7.11%
jan 1, 2011
237.408
+40.06
20.3%
jan 1, 2012
232.45
-4.958
-2.09%
jan 1, 2013
194.022
-38.428
-16.53%
jan 1, 2014
176.426
-17.595
-9.07%
jan 1, 2015
184.097
+7.67
4.35%
jan 1, 2016
165.523
-18.574
-10.09%
Ranking of countries by current statistics by years