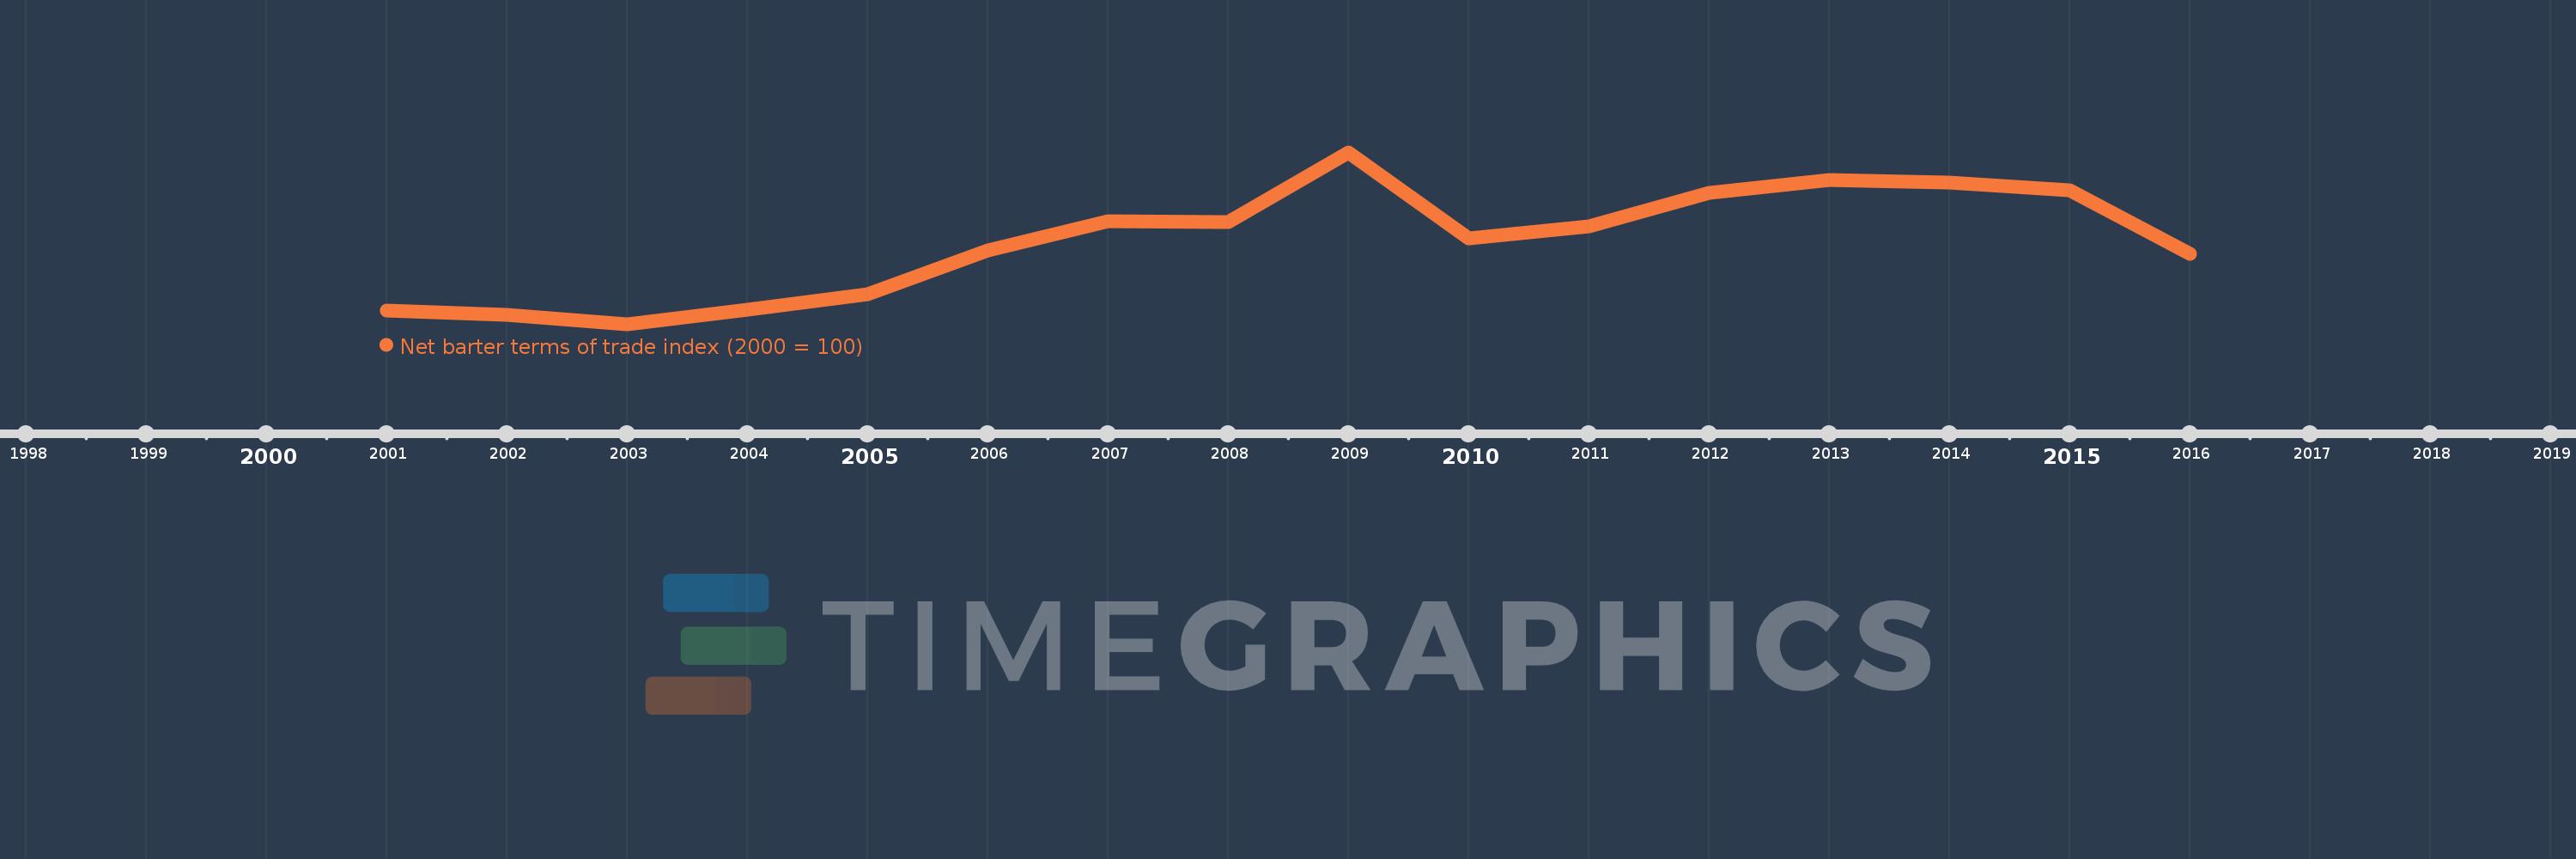
This timeline shows a graph from 2001 to 2016 of Qatar. No data until 2000. Number of actual observations by date: 16.
Source name:
World Development Indicators
Source organization:
United Nations Conference on Trade and Development, Handbook of Statistics and data files, and International Monetary Fund, International Financial Statistics.
Categories, topics:
Private Sector, Trade
Last updated:
apr 23, 2017
Indicators value changes by year
Meaning:
165.034
Minimum:
86.973
jan 1, 2003
Maximum:
249.352
jan 1, 2009
At the date of observation
Value
Absolute change
Change from the previous value
jan 1, 2001
100.0
+100.0
0.0%
jan 1, 2002
95.784
-4.216
-4.22%
jan 1, 2003
86.973
-8.811
-9.2%
jan 1, 2004
100.308
+13.334
15.33%
jan 1, 2005
115.064
+14.757
14.71%
jan 1, 2006
156.921
+41.857
36.38%
jan 1, 2007
184.008
+27.087
17.26%
jan 1, 2008
183.501
-0.507
-0.28%
jan 1, 2009
249.352
+65.851
35.89%
jan 1, 2010
167.698
-81.653
-32.75%
jan 1, 2011
179.301
+11.602
6.92%
jan 1, 2012
210.947
+31.646
17.65%
jan 1, 2013
223.1
+12.153
5.76%
jan 1, 2014
220.721
-2.379
-1.07%
jan 1, 2015
213.49
-7.23
-3.28%
jan 1, 2016
153.376
-60.114
-28.16%
Ranking of countries by current statistics by years