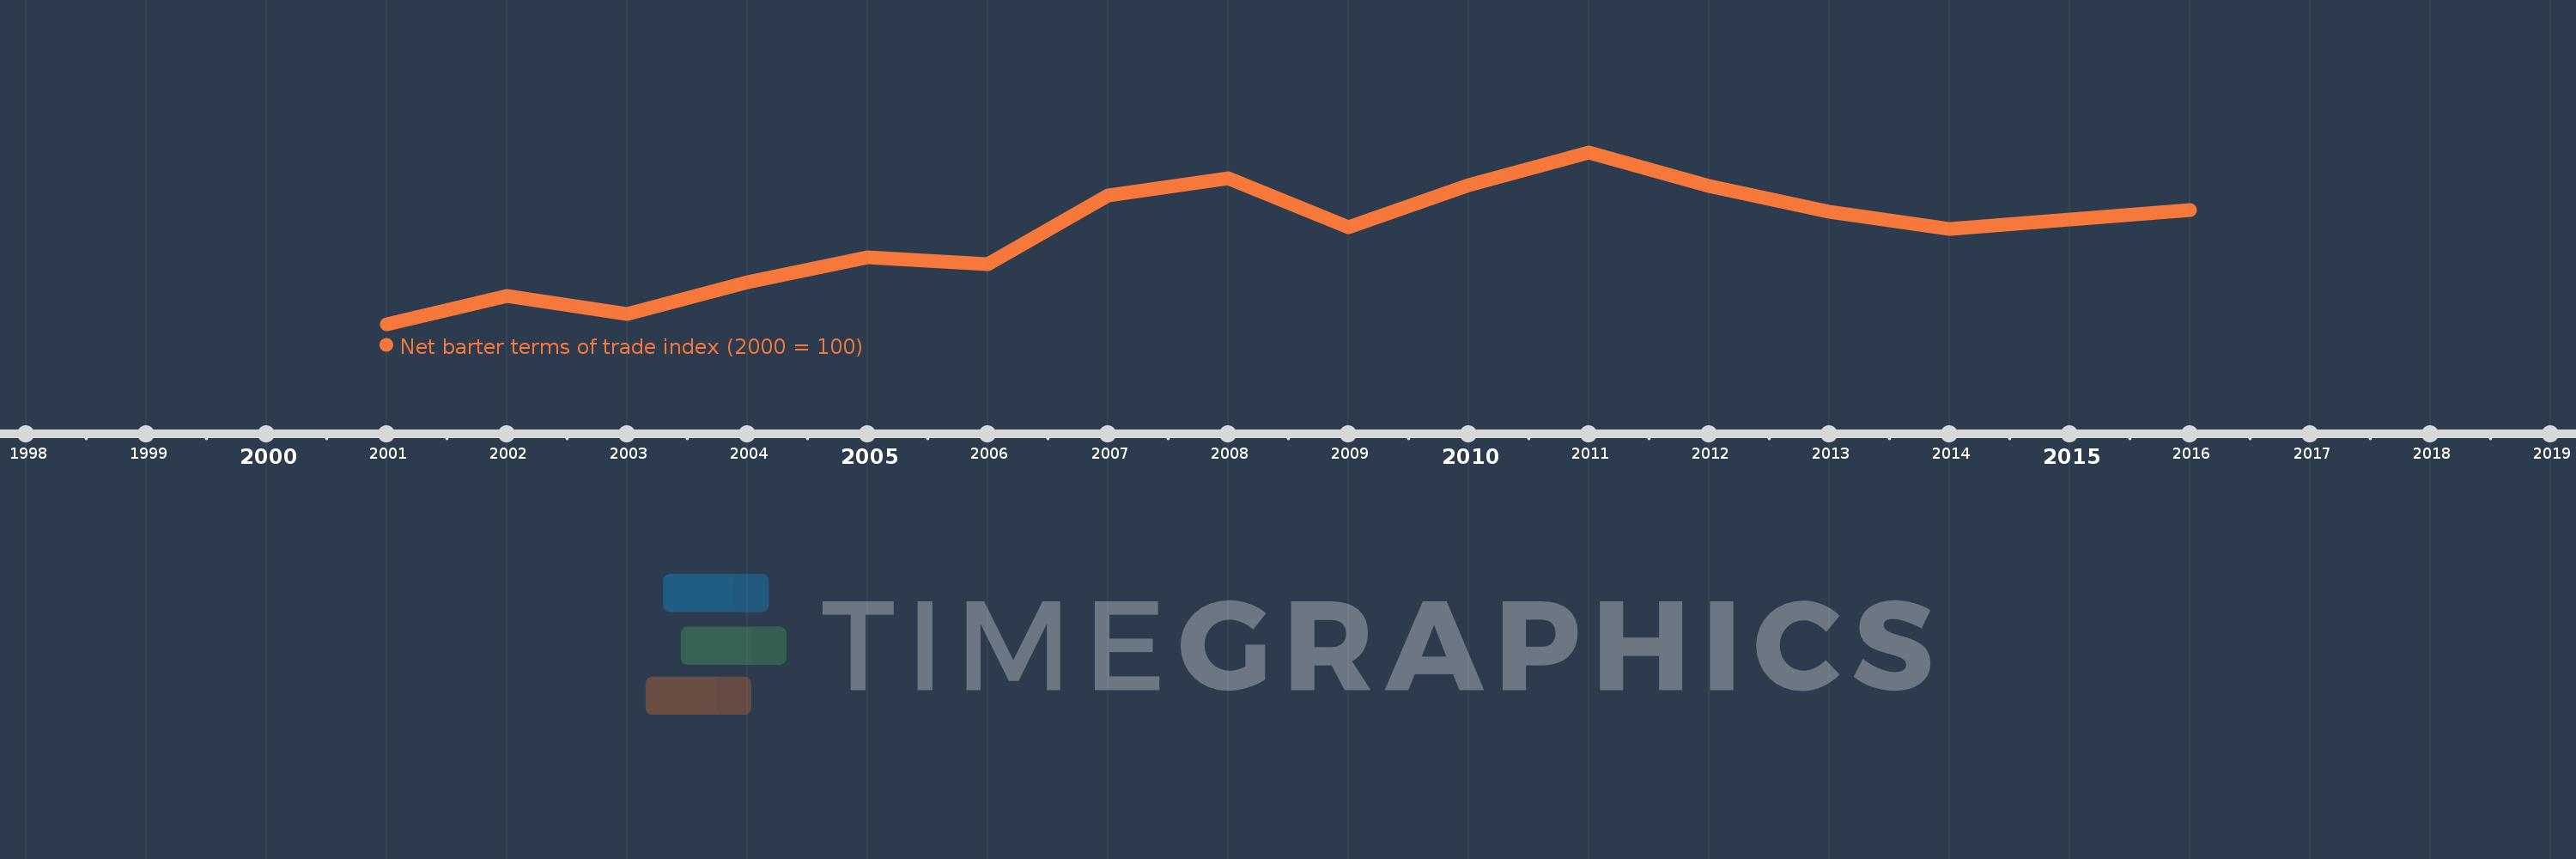
This timeline shows a graph from 2001 to 2016 of Cuba. No data until 2000. Number of actual observations by date: 16.
Source name:
World Development Indicators
Source organization:
United Nations Conference on Trade and Development, Handbook of Statistics and data files, and International Monetary Fund, International Financial Statistics.
Categories, topics:
Private Sector, Trade
Last updated:
apr 23, 2017
Indicators value changes by year
Meaning:
145.277
Minimum:
100.0
jan 1, 2001
Maximum:
185.629
jan 1, 2011
At the date of observation
Value
Absolute change
Change from the previous value
jan 1, 2001
100.0
+100.0
0.0%
jan 1, 2002
114.043
+14.043
14.04%
jan 1, 2003
105.061
-8.982
-7.88%
jan 1, 2004
120.981
+15.92
15.15%
jan 1, 2005
133.342
+12.361
10.22%
jan 1, 2006
129.847
-3.494
-2.62%
jan 1, 2007
164.004
+34.156
26.3%
jan 1, 2008
172.56
+8.557
5.22%
jan 1, 2009
148.214
-24.346
-14.11%
jan 1, 2010
169.11
+20.895
14.1%
jan 1, 2011
185.629
+16.519
9.77%
jan 1, 2012
168.955
-16.674
-8.98%
jan 1, 2013
156.225
-12.731
-7.53%
jan 1, 2014
147.429
-8.796
-5.63%
jan 1, 2015
152.151
+4.722
3.2%
jan 1, 2016
156.874
+4.723
3.1%
Ranking of countries by current statistics by years