This timeline shows a graph from 2001 to 2016 of Canada. No data until 2000. Number of actual observations by date: 16.
Source name:
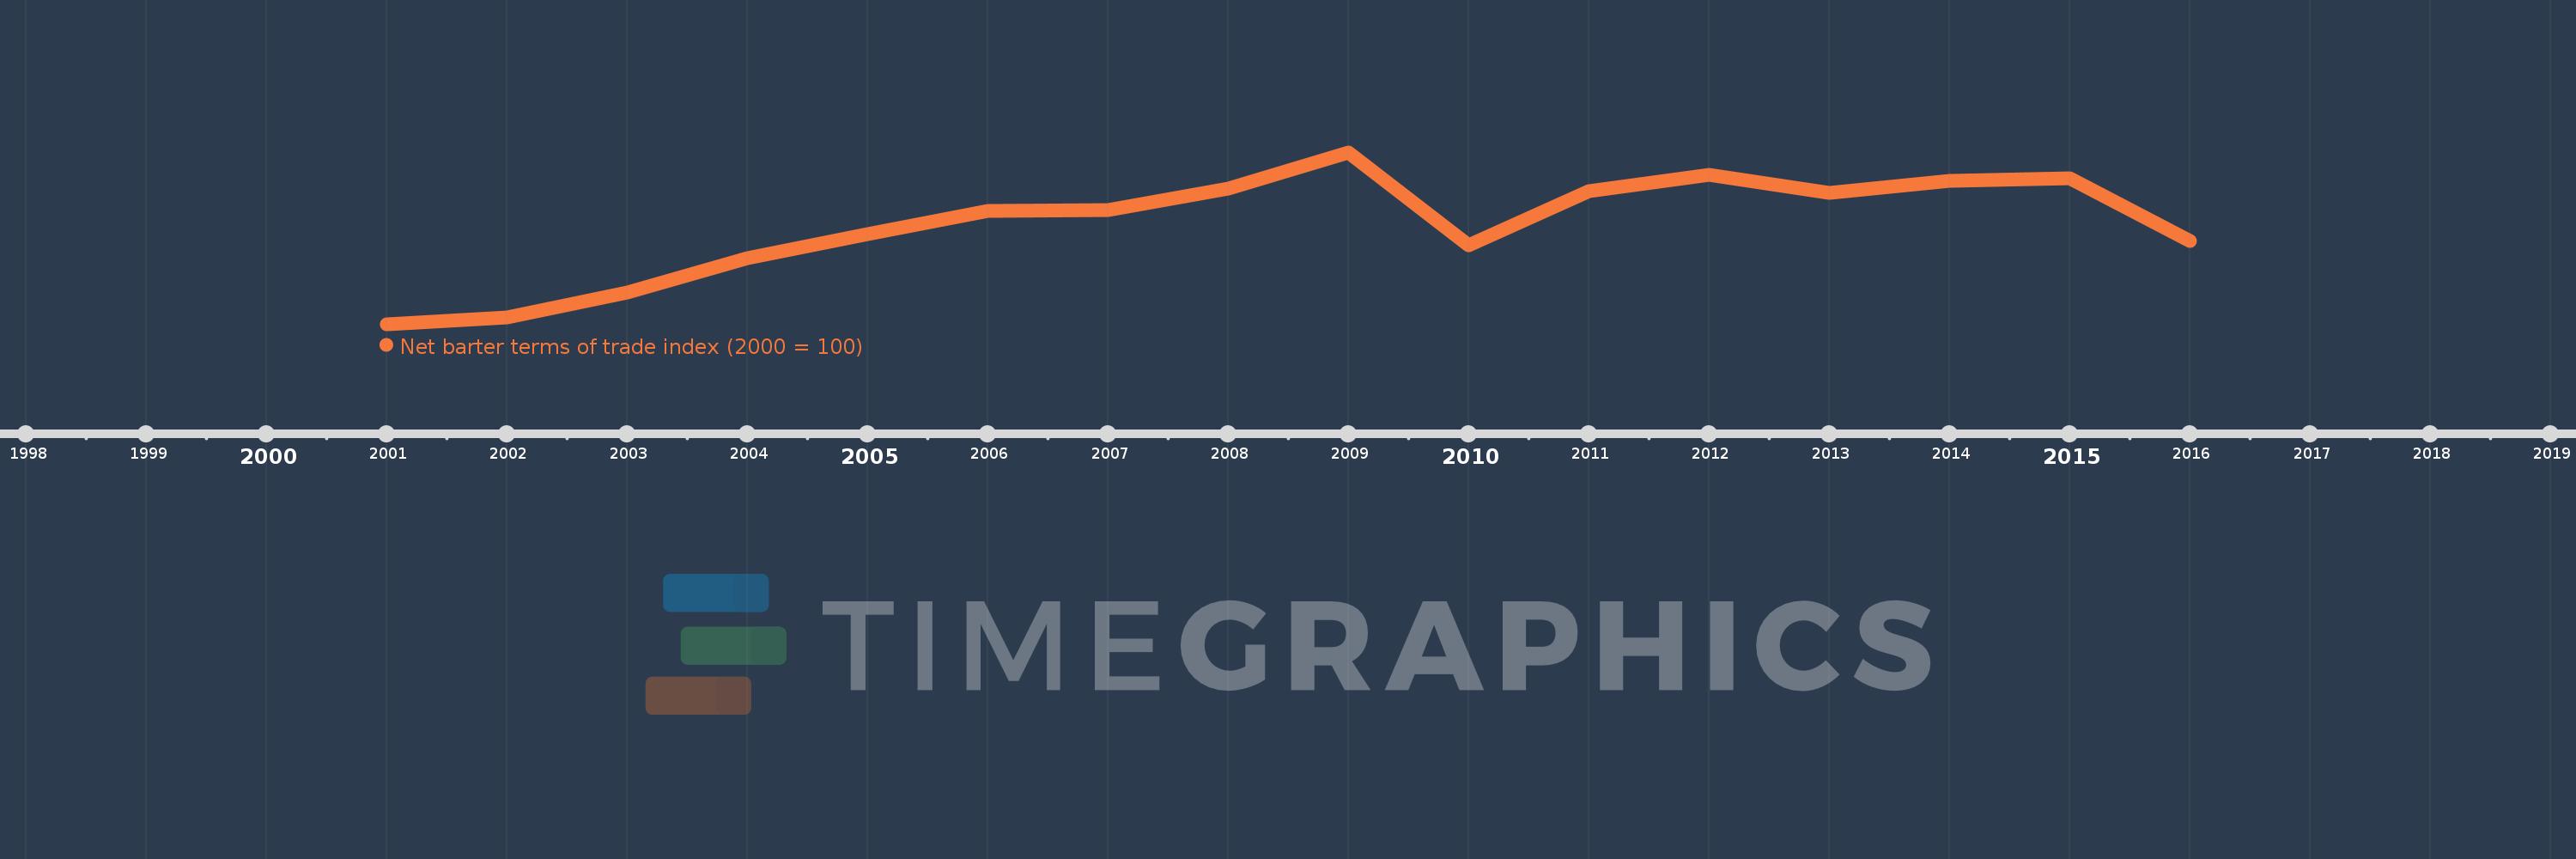
World Development Indicators
Source organization:
United Nations Conference on Trade and Development, Handbook of Statistics and data files, and International Monetary Fund, International Financial Statistics.
Categories, topics:
Private Sector, Trade
Last updated:
apr 23, 2017
Indicators value changes by year
Meaning:
117.319
Minimum:
100.0
jan 1, 2001
Maximum:
129.88
jan 1, 2009
At the date of observation
Value
Absolute change
Change from the previous value
jan 1, 2001
100.0
+100.0
0.0%
jan 1, 2002
101.143
+1.143
1.14%
jan 1, 2003
105.463
+4.32
4.27%
jan 1, 2004
111.445
+5.982
5.67%
jan 1, 2005
115.611
+4.166
3.74%
jan 1, 2006
119.72
+4.109
3.55%
jan 1, 2007
119.808
+0.088
0.07%
jan 1, 2008
123.548
+3.74
3.12%
jan 1, 2009
129.88
+6.332
5.13%
jan 1, 2010
113.729
-16.151
-12.44%
jan 1, 2011
123.137
+9.407
8.27%
jan 1, 2012
126.014
+2.878
2.34%
jan 1, 2013
122.855
-3.159
-2.51%
jan 1, 2014
124.918
+2.063
1.68%
jan 1, 2015
125.417
+0.499
0.4%
jan 1, 2016
114.42
-10.996
-8.77%
Ranking of countries by current statistics by years