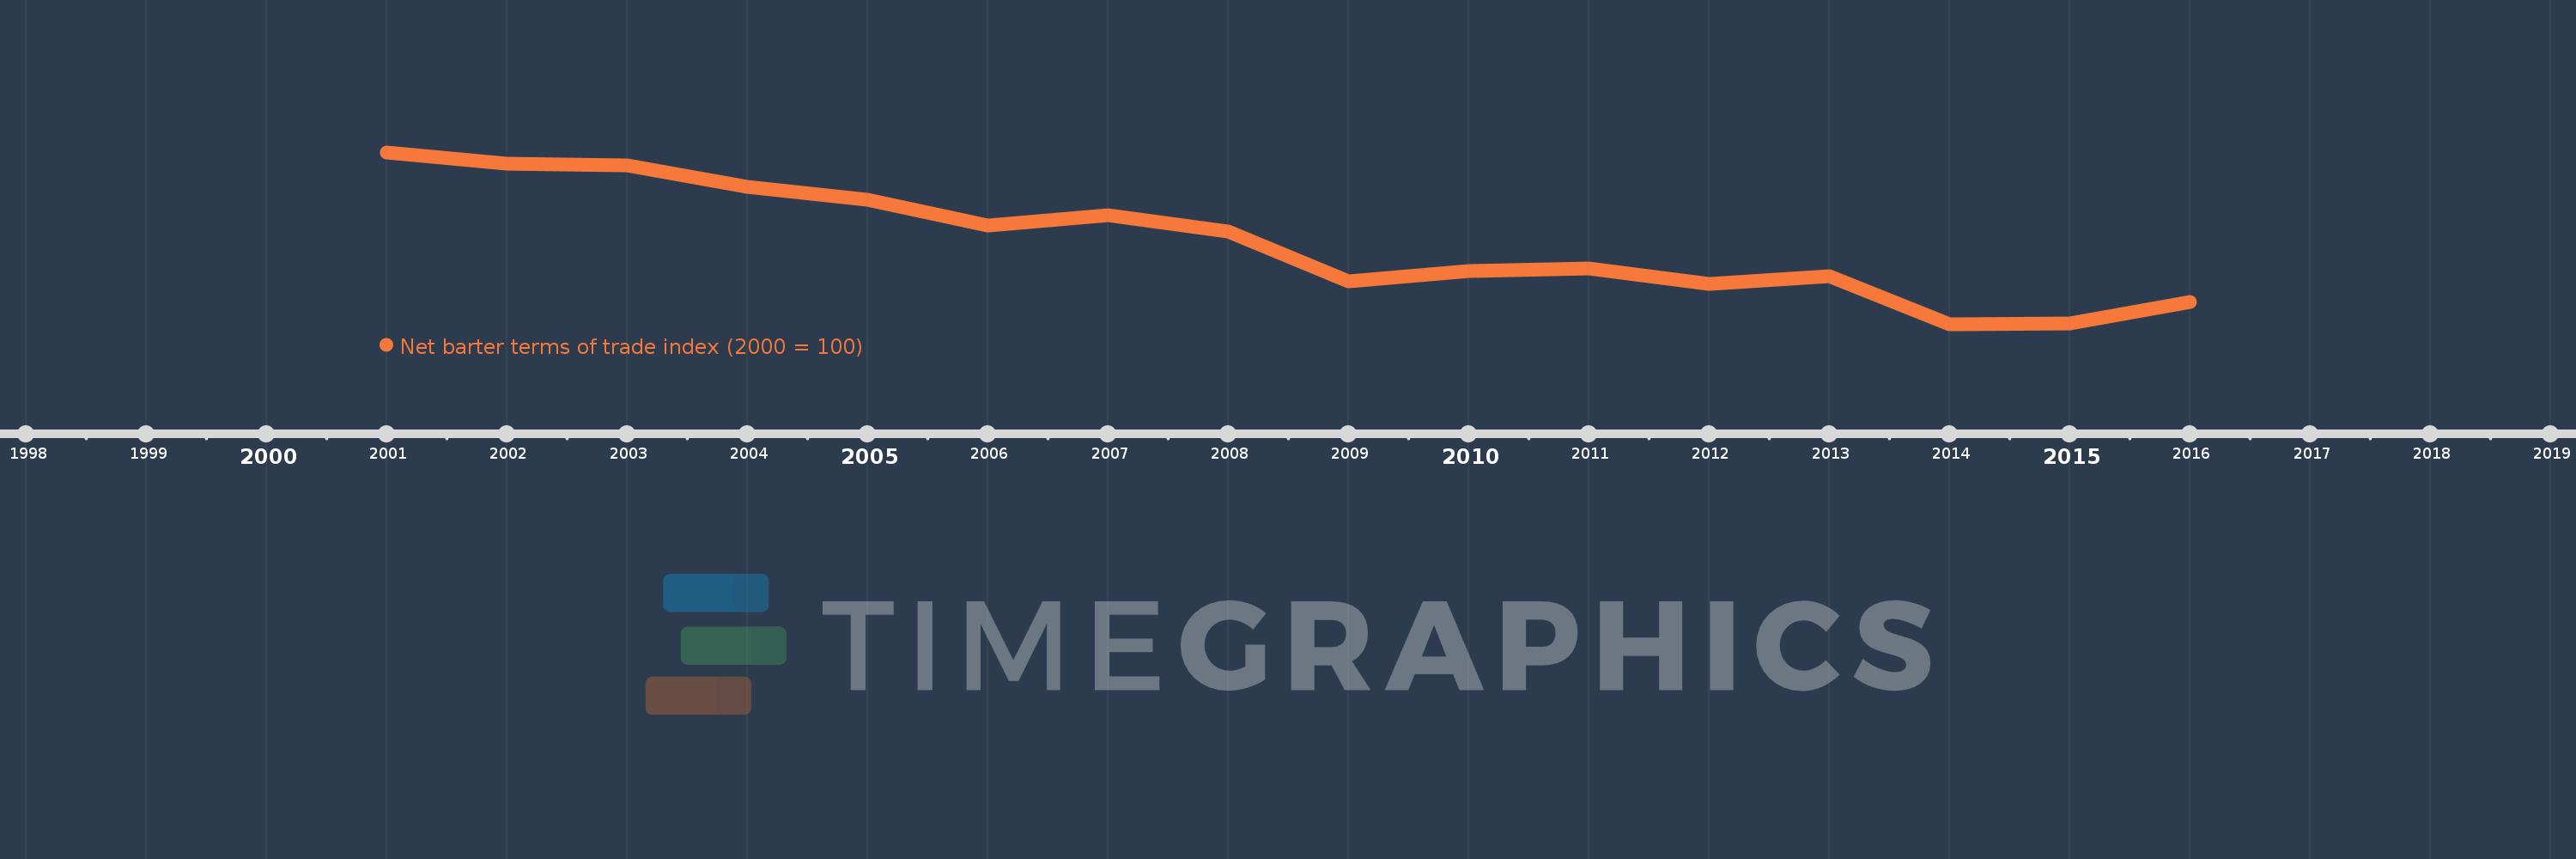
This timeline shows a graph from 2001 to 2016 of Cayman Islands. No data until 2000. Number of actual observations by date: 16.
Source name:
World Development Indicators
Source organization:
United Nations Conference on Trade and Development, Handbook of Statistics and data files, and International Monetary Fund, International Financial Statistics.
Categories, topics:
Private Sector, Trade
Last updated:
apr 23, 2017
Indicators value changes by year
Meaning:
80.085
Minimum:
61.801
jan 1, 2014
Maximum:
100.0
jan 1, 2001
At the date of observation
Value
Absolute change
Change from the previous value
jan 1, 2001
100.0
+100.0
0.0%
jan 1, 2002
97.559
-2.441
-2.44%
jan 1, 2003
97.181
-0.378
-0.39%
jan 1, 2004
92.302
-4.879
-5.02%
jan 1, 2005
89.453
-2.848
-3.09%
jan 1, 2006
83.704
-5.75
-6.43%
jan 1, 2007
85.945
+2.241
2.68%
jan 1, 2008
82.357
-3.588
-4.17%
jan 1, 2009
71.323
-11.033
-13.4%
jan 1, 2010
73.687
+2.364
3.31%
jan 1, 2011
74.109
+0.422
0.57%
jan 1, 2012
70.711
-3.398
-4.59%
jan 1, 2013
72.384
+1.673
2.37%
jan 1, 2014
61.801
-10.583
-14.62%
jan 1, 2015
62.008
+0.207
0.34%
jan 1, 2016
66.843
+4.835
7.8%
Ranking of countries by current statistics by years