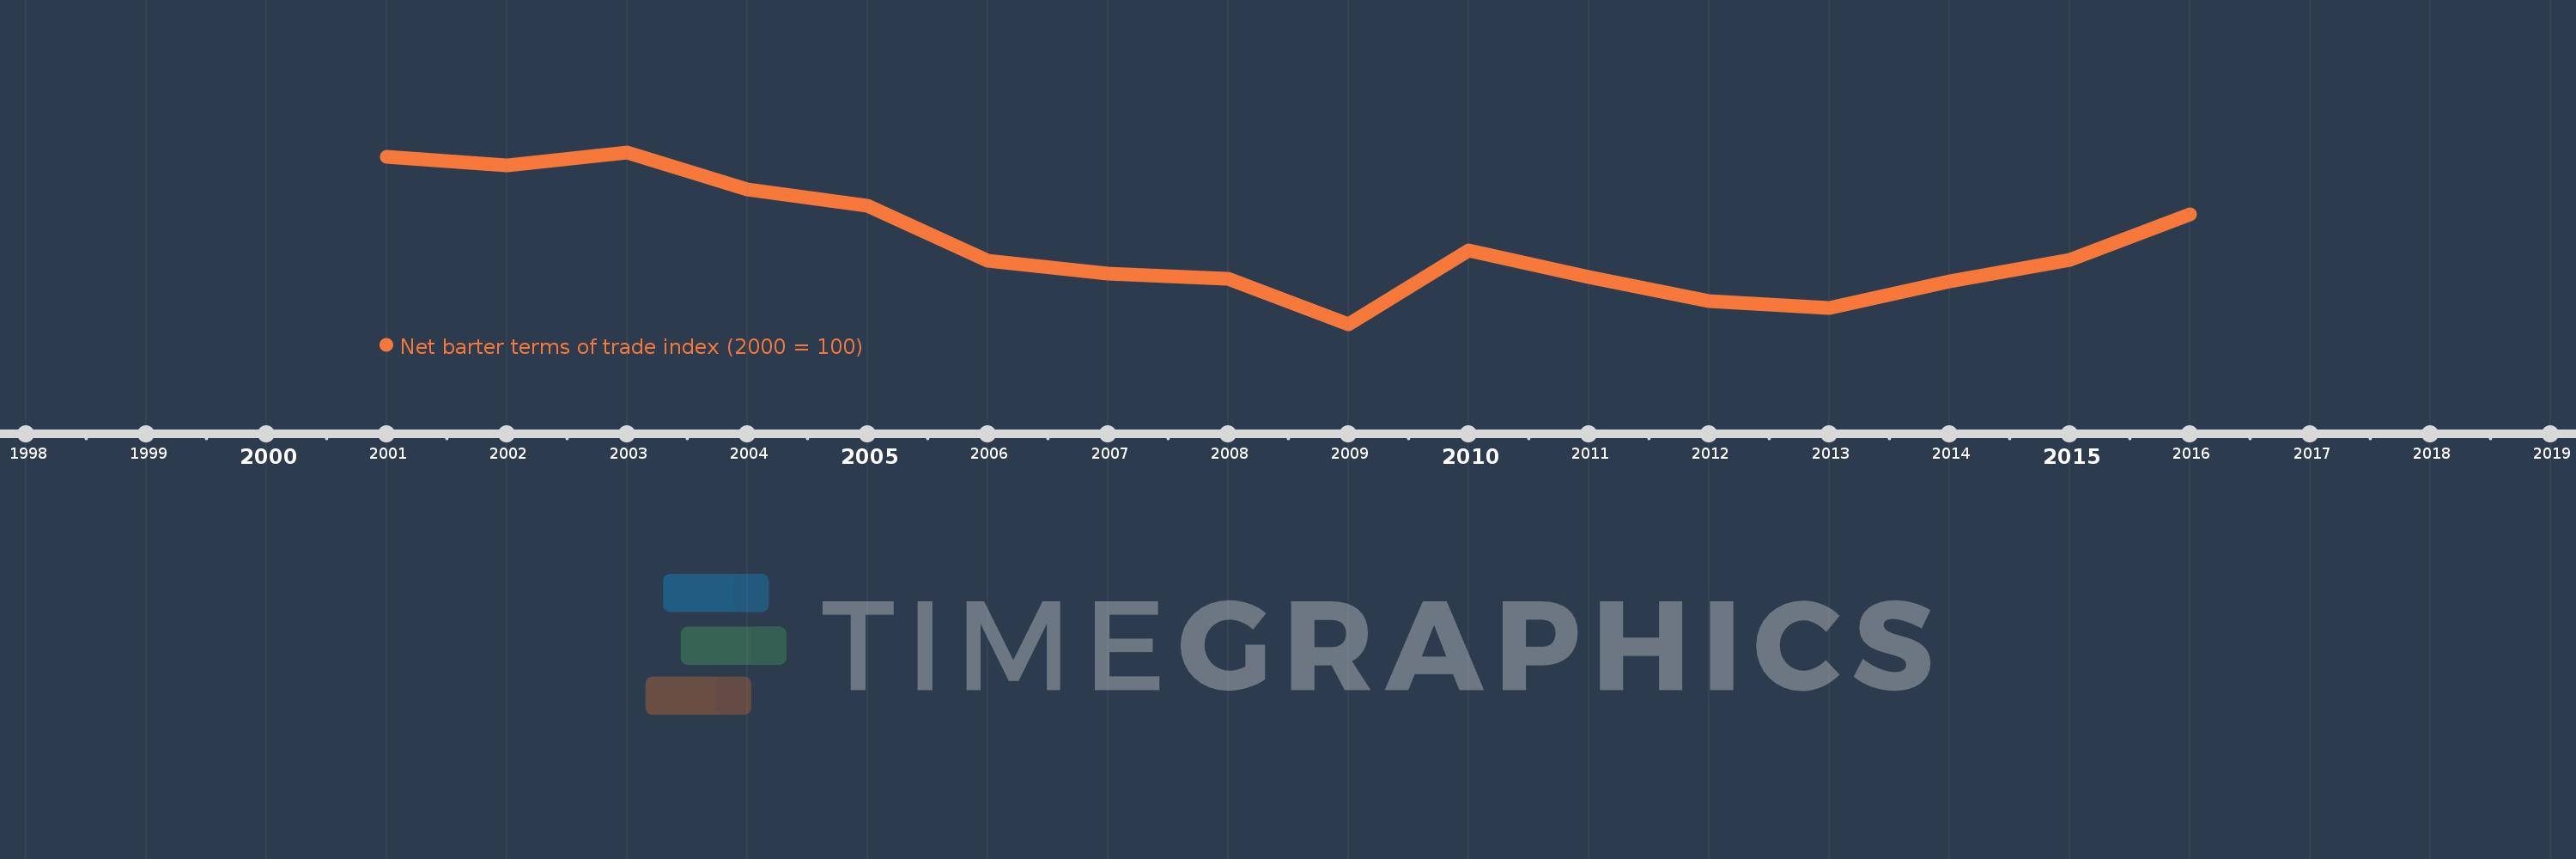
This timeline shows a graph from 2001 to 2016 of Portugal. No data until 2000. Number of actual observations by date: 16.
Source name:
World Development Indicators
Source organization:
United Nations Conference on Trade and Development, Handbook of Statistics and data files, and International Monetary Fund, International Financial Statistics.
Categories, topics:
Private Sector, Trade
Last updated:
apr 23, 2017
Indicators value changes by year
Meaning:
95.123
Minimum:
90.594
jan 1, 2009
Maximum:
100.27
jan 1, 2003
At the date of observation
Value
Absolute change
Change from the previous value
jan 1, 2001
100.0
+100.0
0.0%
jan 1, 2002
99.549
-0.451
-0.45%
jan 1, 2003
100.27
+0.721
0.72%
jan 1, 2004
98.165
-2.105
-2.1%
jan 1, 2005
97.249
-0.916
-0.93%
jan 1, 2006
94.189
-3.06
-3.15%
jan 1, 2007
93.448
-0.74
-0.79%
jan 1, 2008
93.155
-0.294
-0.31%
jan 1, 2009
90.594
-2.56
-2.75%
jan 1, 2010
94.745
+4.151
4.58%
jan 1, 2011
93.251
-1.494
-1.58%
jan 1, 2012
91.877
-1.374
-1.47%
jan 1, 2013
91.504
-0.373
-0.41%
jan 1, 2014
92.997
+1.493
1.63%
jan 1, 2015
94.196
+1.199
1.29%
jan 1, 2016
96.783
+2.587
2.75%
Ranking of countries by current statistics by years