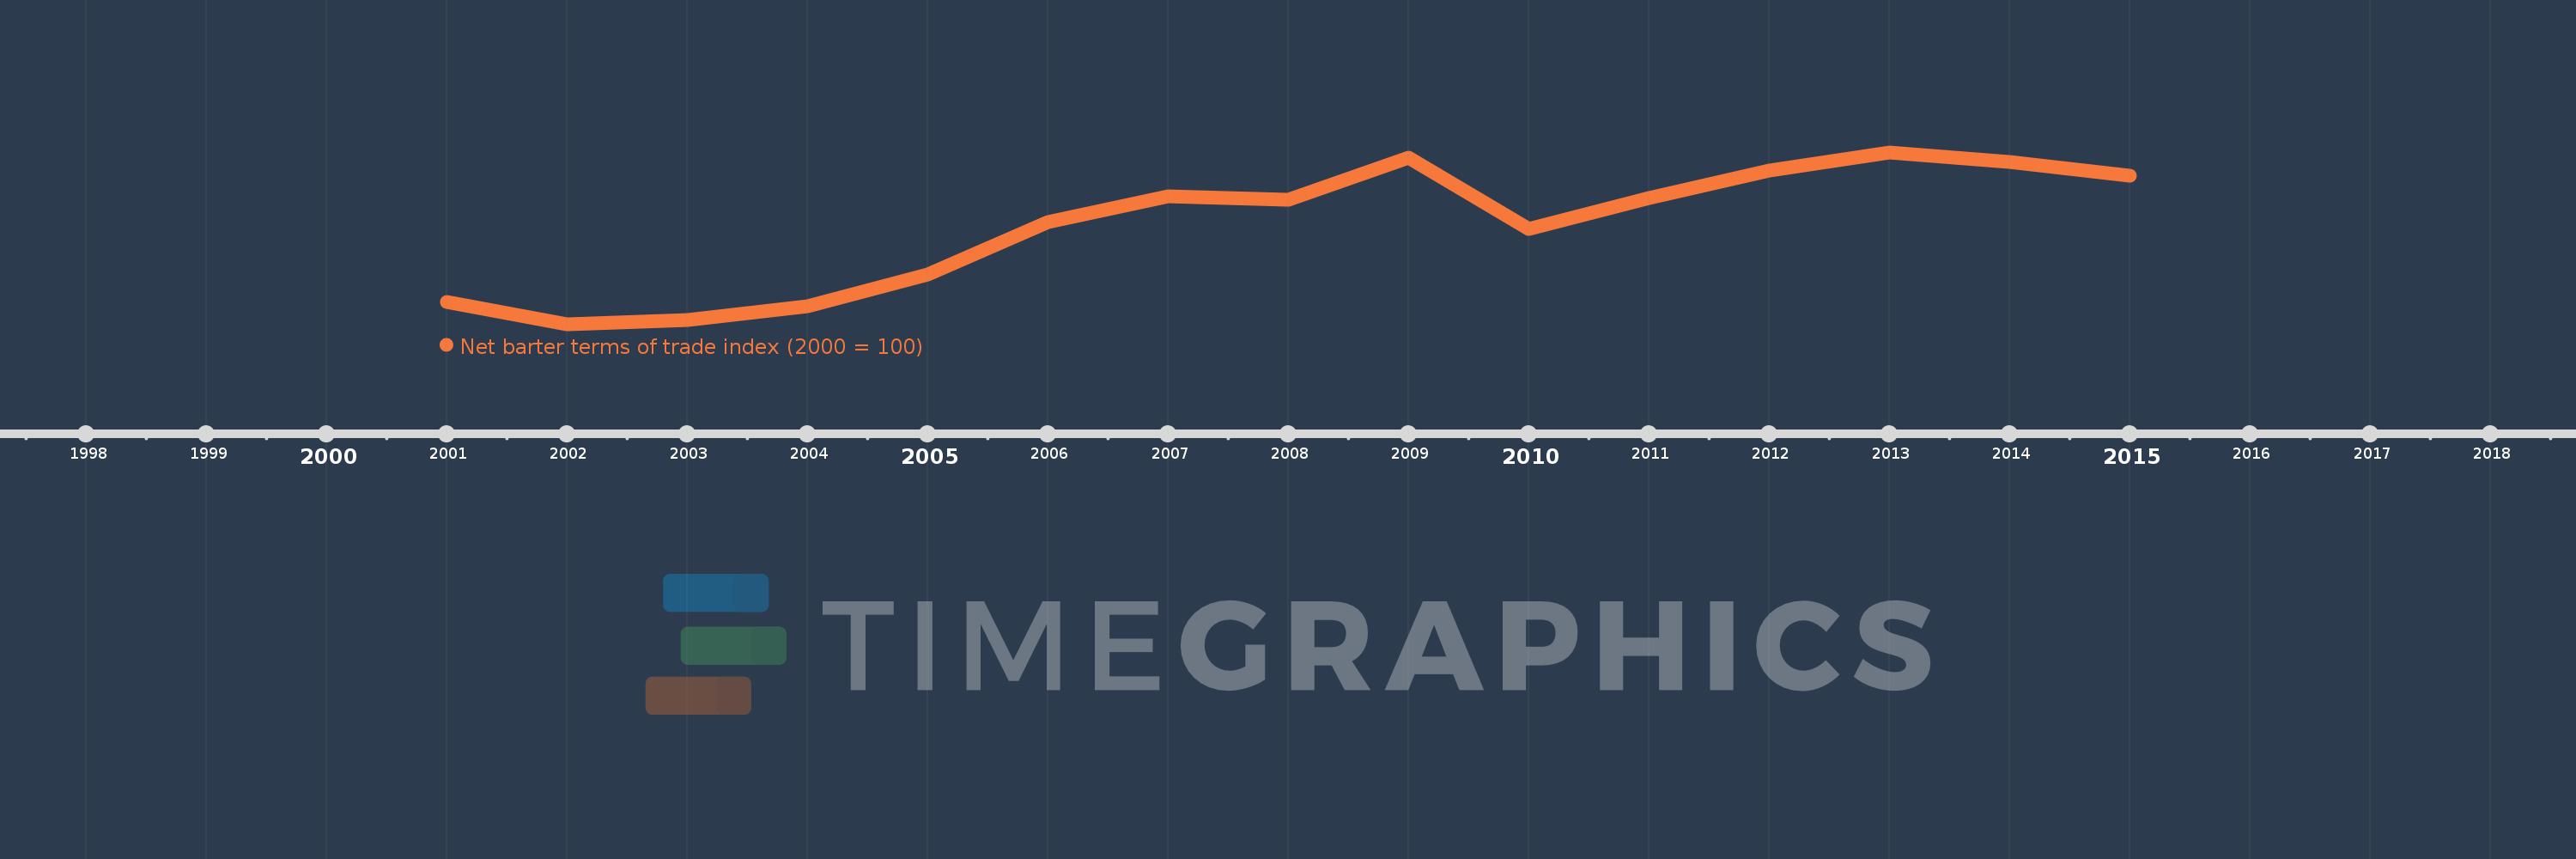
This timeline shows a graph from 2001 to 2015 of Yemen, Rep.. No data until 2000. Number of actual observations by date: 15.
Source name:
World Development Indicators
Source organization:
United Nations Conference on Trade and Development, Handbook of Statistics and data files, and International Monetary Fund, International Financial Statistics.
Categories, topics:
Private Sector, Trade
Last updated:
apr 23, 2017
Indicators value changes by year
Meaning:
136.371
Minimum:
89.392
jan 1, 2002
Maximum:
171.623
jan 1, 2013
At the date of observation
Value
Absolute change
Change from the previous value
jan 1, 2001
100.0
+100.0
0.0%
jan 1, 2002
89.392
-10.608
-10.61%
jan 1, 2003
91.298
+1.906
2.13%
jan 1, 2004
97.952
+6.654
7.29%
jan 1, 2005
113.187
+15.236
15.55%
jan 1, 2006
138.347
+25.159
22.23%
jan 1, 2007
150.512
+12.165
8.79%
jan 1, 2008
148.948
-1.564
-1.04%
jan 1, 2009
169.184
+20.236
13.59%
jan 1, 2010
134.962
-34.222
-20.23%
jan 1, 2011
149.63
+14.668
10.87%
jan 1, 2012
162.929
+13.299
8.89%
jan 1, 2013
171.623
+8.695
5.34%
jan 1, 2014
166.932
-4.691
-2.73%
jan 1, 2015
160.662
-6.27
-3.76%
Ranking of countries by current statistics by years