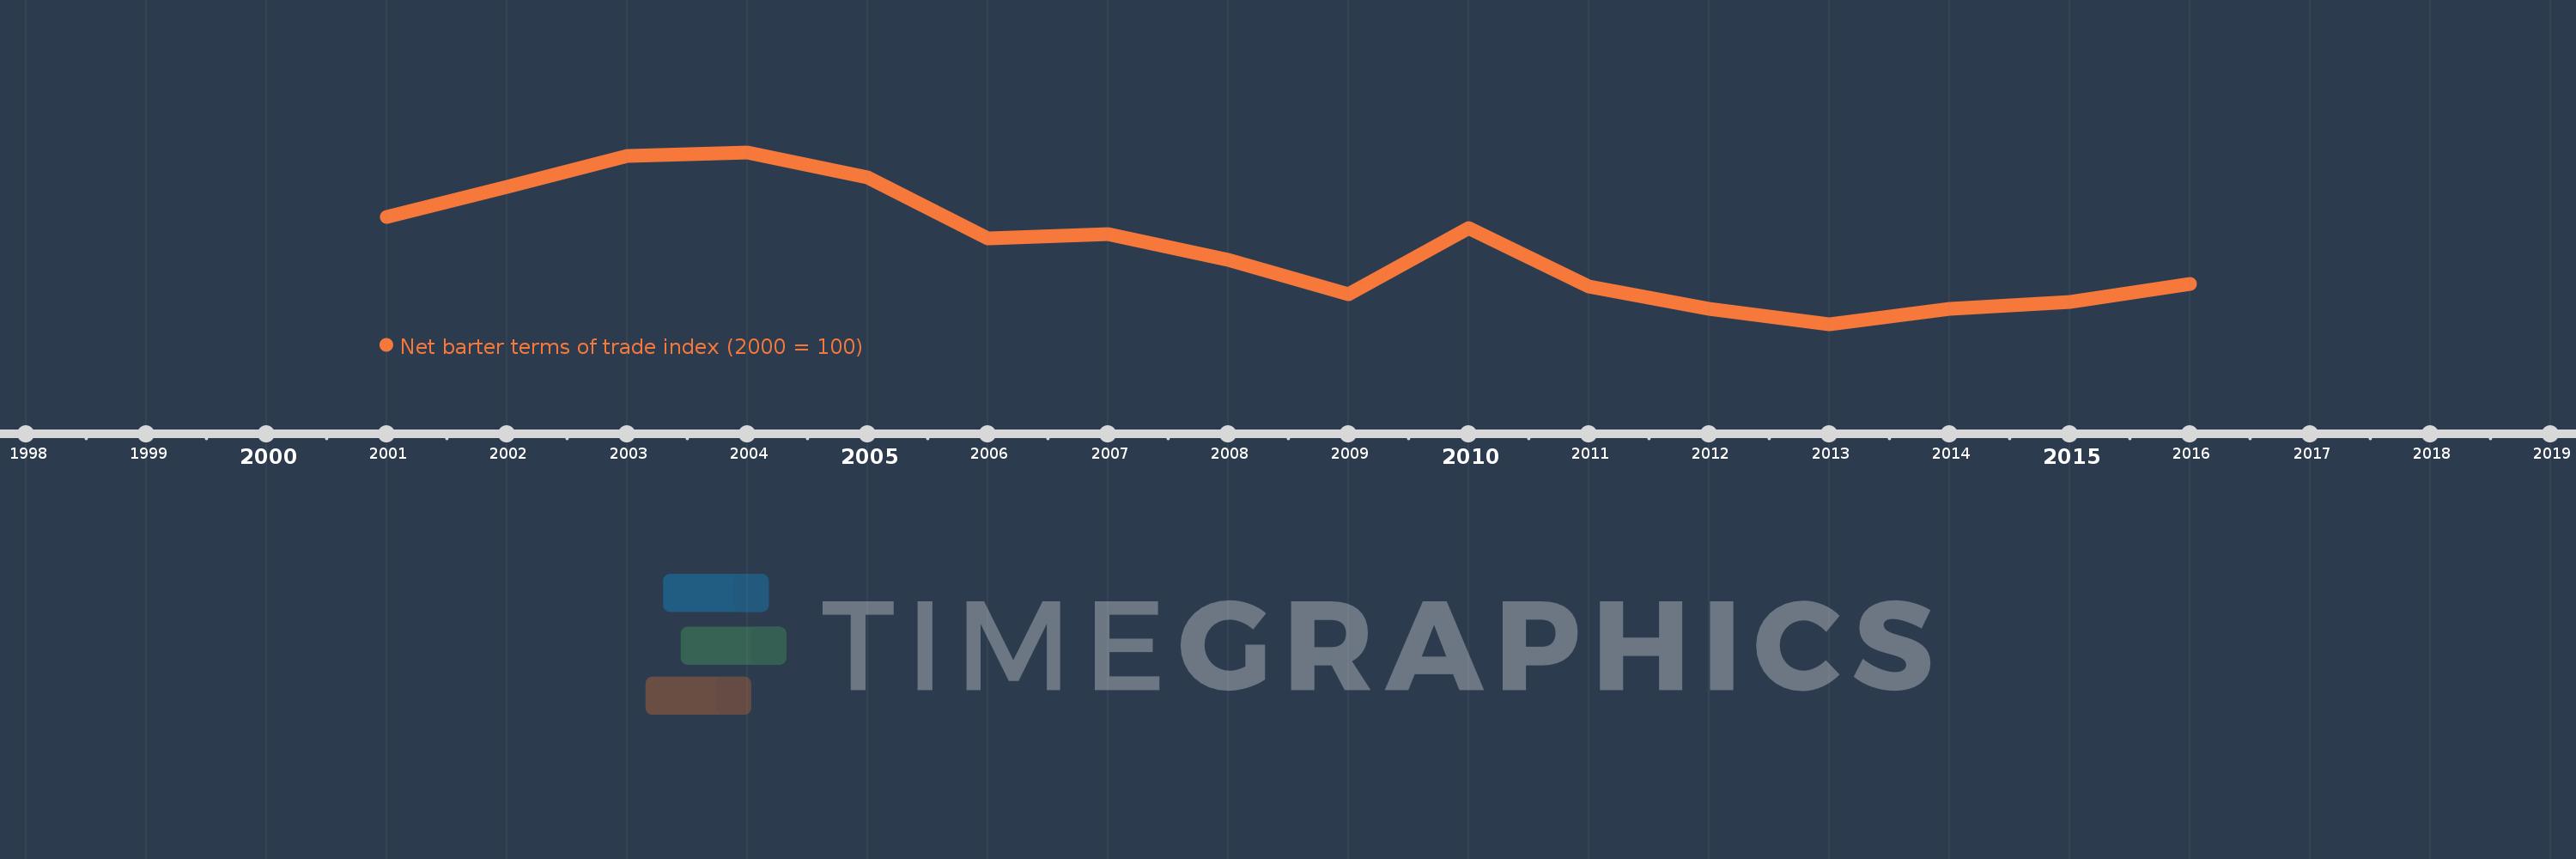
This timeline shows a graph from 2001 to 2016 of Slovenia. No data until 2000. Number of actual observations by date: 16.
Source name:
World Development Indicators
Source organization:
United Nations Conference on Trade and Development, Handbook of Statistics and data files, and International Monetary Fund, International Financial Statistics.
Categories, topics:
Private Sector, Trade
Last updated:
apr 23, 2017
Indicators value changes by year
Meaning:
98.442
Minimum:
94.557
jan 1, 2013
Maximum:
103.254
jan 1, 2004
At the date of observation
Value
Absolute change
Change from the previous value
jan 1, 2001
100.0
+100.0
0.0%
jan 1, 2002
101.513
+1.513
1.51%
jan 1, 2003
103.063
+1.551
1.53%
jan 1, 2004
103.254
+0.19
0.18%
jan 1, 2005
101.988
-1.265
-1.23%
jan 1, 2006
98.886
-3.102
-3.04%
jan 1, 2007
99.138
+0.252
0.26%
jan 1, 2008
97.807
-1.332
-1.34%
jan 1, 2009
96.096
-1.71
-1.75%
jan 1, 2010
99.412
+3.316
3.45%
jan 1, 2011
96.485
-2.927
-2.94%
jan 1, 2012
95.315
-1.17
-1.21%
jan 1, 2013
94.557
-0.758
-0.8%
jan 1, 2014
95.318
+0.761
0.8%
jan 1, 2015
95.662
+0.344
0.36%
jan 1, 2016
96.577
+0.916
0.96%
Ranking of countries by current statistics by years