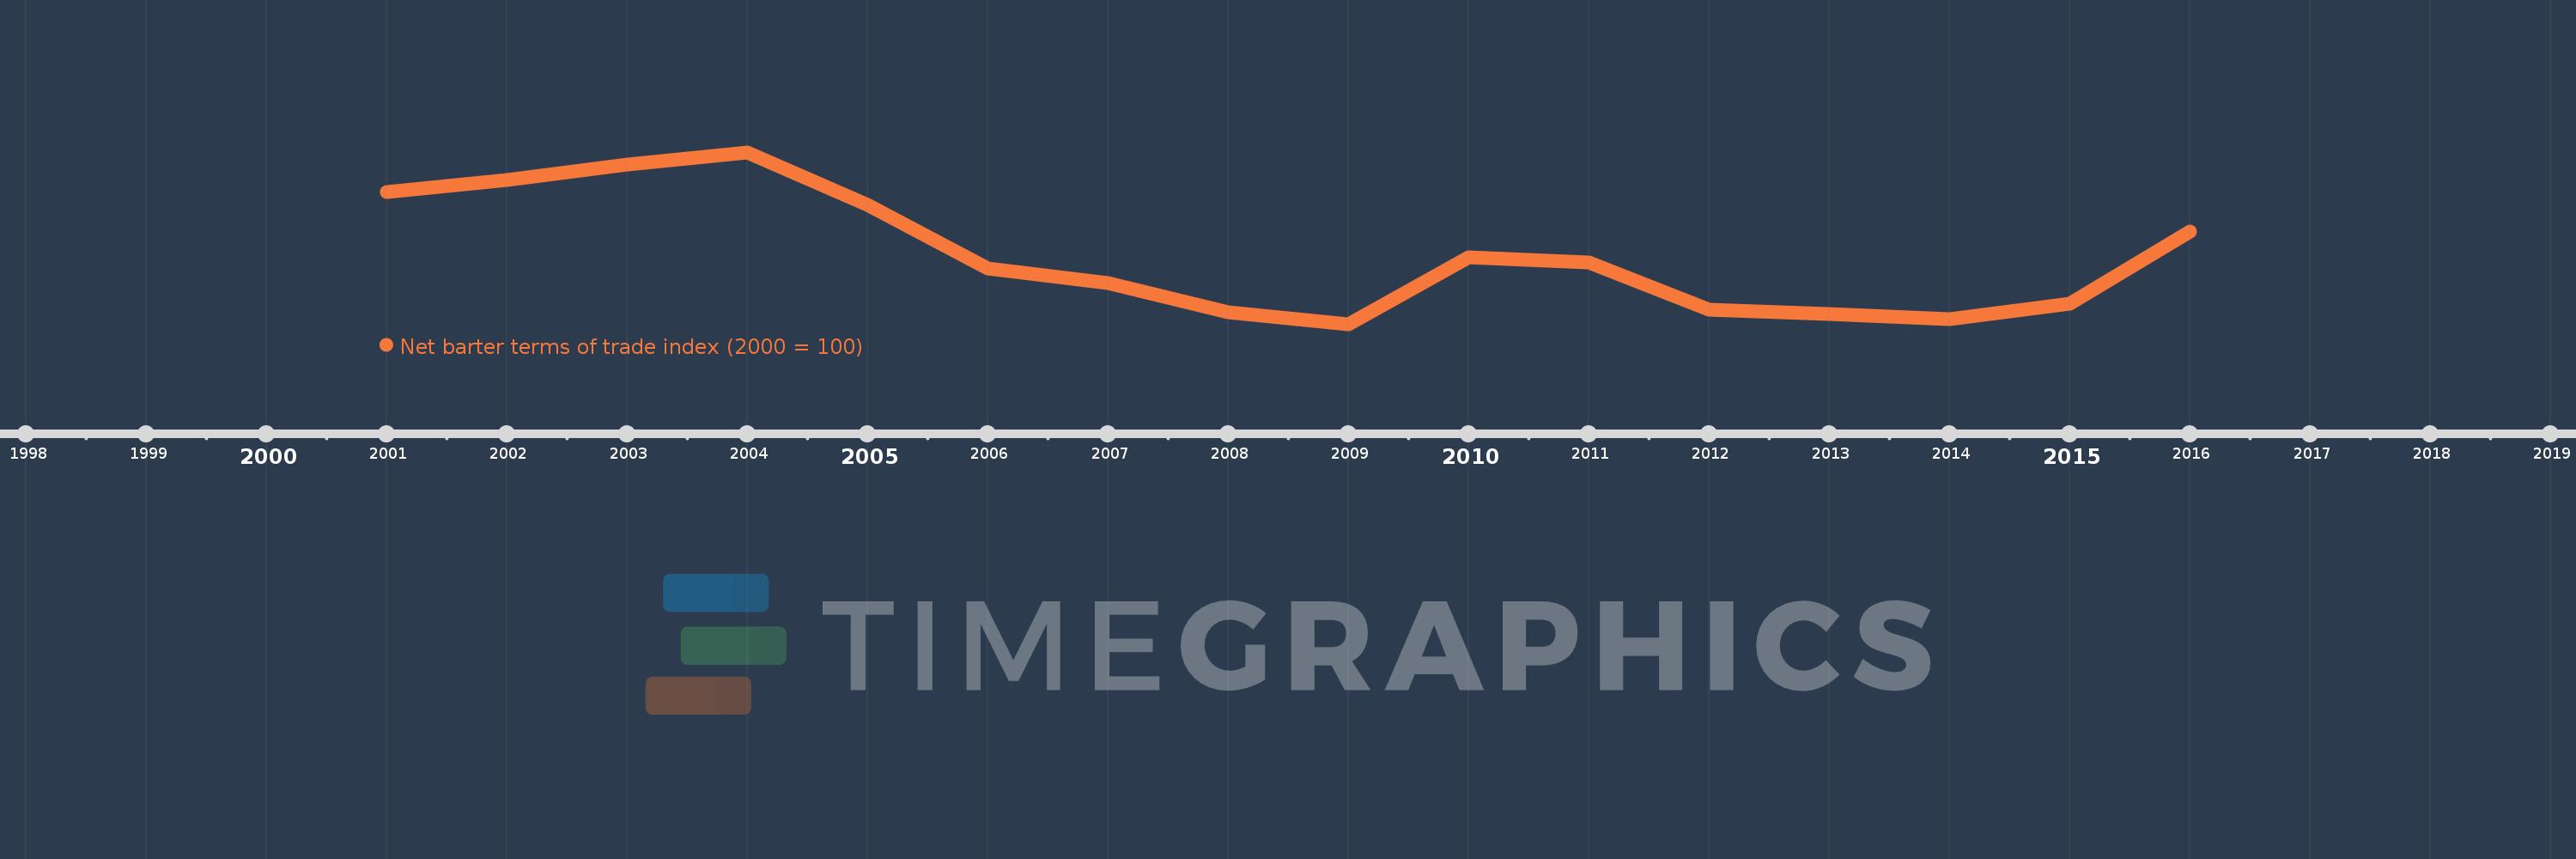
This timeline shows a graph from 2001 to 2016 of Tonga. No data until 2000. Number of actual observations by date: 16.
Source name:
World Development Indicators
Source organization:
United Nations Conference on Trade and Development, Handbook of Statistics and data files, and International Monetary Fund, International Financial Statistics.
Categories, topics:
Private Sector, Trade
Last updated:
apr 23, 2017
Indicators value changes by year
Meaning:
91.814
Minimum:
82.782
jan 1, 2009
Maximum:
105.218
jan 1, 2004
At the date of observation
Value
Absolute change
Change from the previous value
jan 1, 2001
100.0
+100.0
0.0%
jan 1, 2002
101.616
+1.616
1.62%
jan 1, 2003
103.628
+2.013
1.98%
jan 1, 2004
105.218
+1.59
1.53%
jan 1, 2005
98.338
-6.88
-6.54%
jan 1, 2006
90.031
-8.307
-8.45%
jan 1, 2007
88.12
-1.912
-2.12%
jan 1, 2008
84.328
-3.791
-4.3%
jan 1, 2009
82.782
-1.546
-1.83%
jan 1, 2010
91.487
+8.705
10.52%
jan 1, 2011
90.846
-0.641
-0.7%
jan 1, 2012
84.731
-6.114
-6.73%
jan 1, 2013
84.139
-0.592
-0.7%
jan 1, 2014
83.427
-0.713
-0.85%
jan 1, 2015
85.501
+2.074
2.49%
jan 1, 2016
94.831
+9.33
10.91%
Ranking of countries by current statistics by years