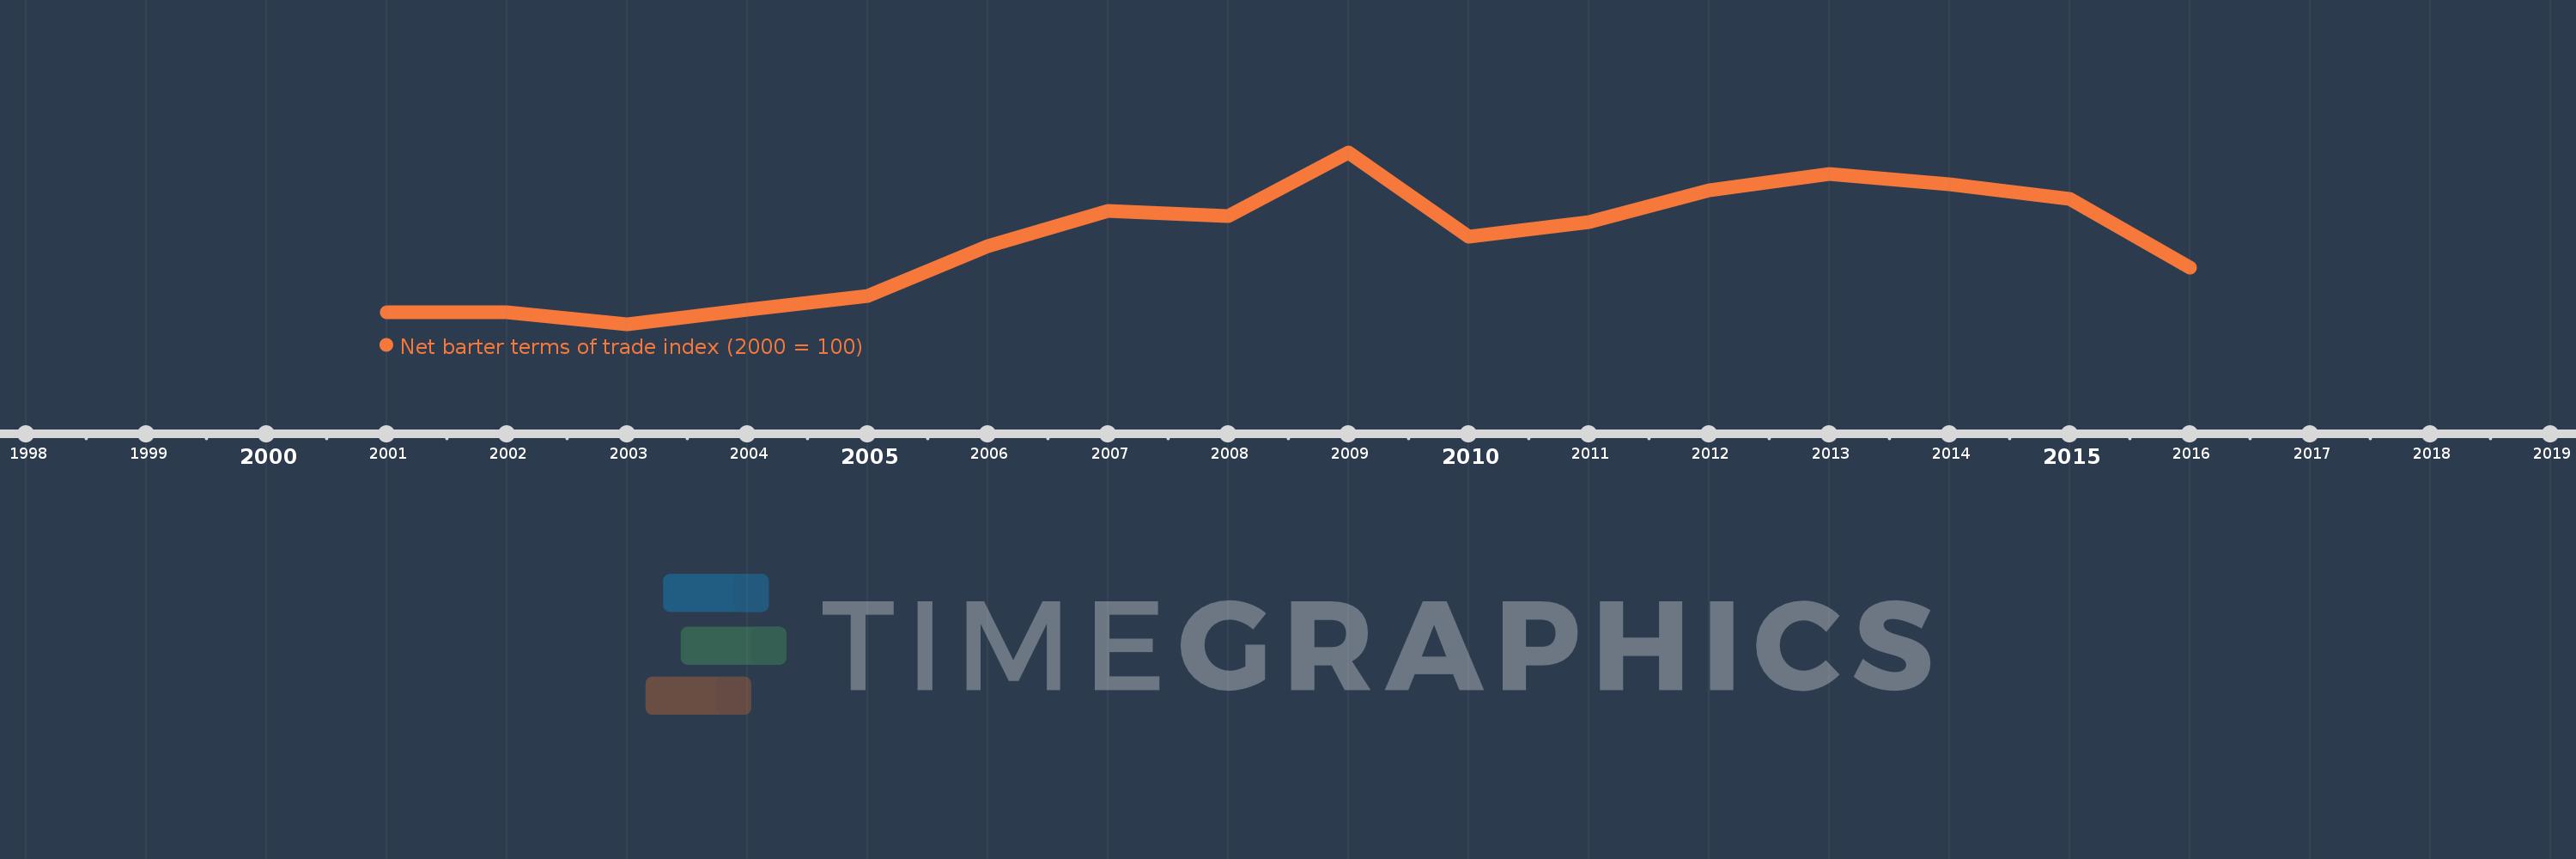
This timeline shows a graph from 2001 to 2016 of Brunei Darussalam. No data until 2000. Number of actual observations by date: 16.
Source name:
World Development Indicators
Source organization:
United Nations Conference on Trade and Development, Handbook of Statistics and data files, and International Monetary Fund, International Financial Statistics.
Categories, topics:
Private Sector, Trade
Last updated:
apr 23, 2017
Indicators value changes by year
Meaning:
164.337
Minimum:
89.058
jan 1, 2003
Maximum:
244.366
jan 1, 2009
At the date of observation
Value
Absolute change
Change from the previous value
jan 1, 2001
100.0
+100.0
0.0%
jan 1, 2002
100.101
+0.101
0.1%
jan 1, 2003
89.058
-11.043
-11.03%
jan 1, 2004
102.171
+13.113
14.72%
jan 1, 2005
114.241
+12.069
11.81%
jan 1, 2006
159.512
+45.271
39.63%
jan 1, 2007
191.223
+31.711
19.88%
jan 1, 2008
186.652
-4.571
-2.39%
jan 1, 2009
244.366
+57.714
30.92%
jan 1, 2010
168.355
-76.012
-31.11%
jan 1, 2011
181.214
+12.86
7.64%
jan 1, 2012
209.937
+28.722
15.85%
jan 1, 2013
224.568
+14.631
6.97%
jan 1, 2014
215.863
-8.705
-3.88%
jan 1, 2015
202.001
-13.862
-6.42%
jan 1, 2016
140.122
-61.879
-30.63%
Ranking of countries by current statistics by years