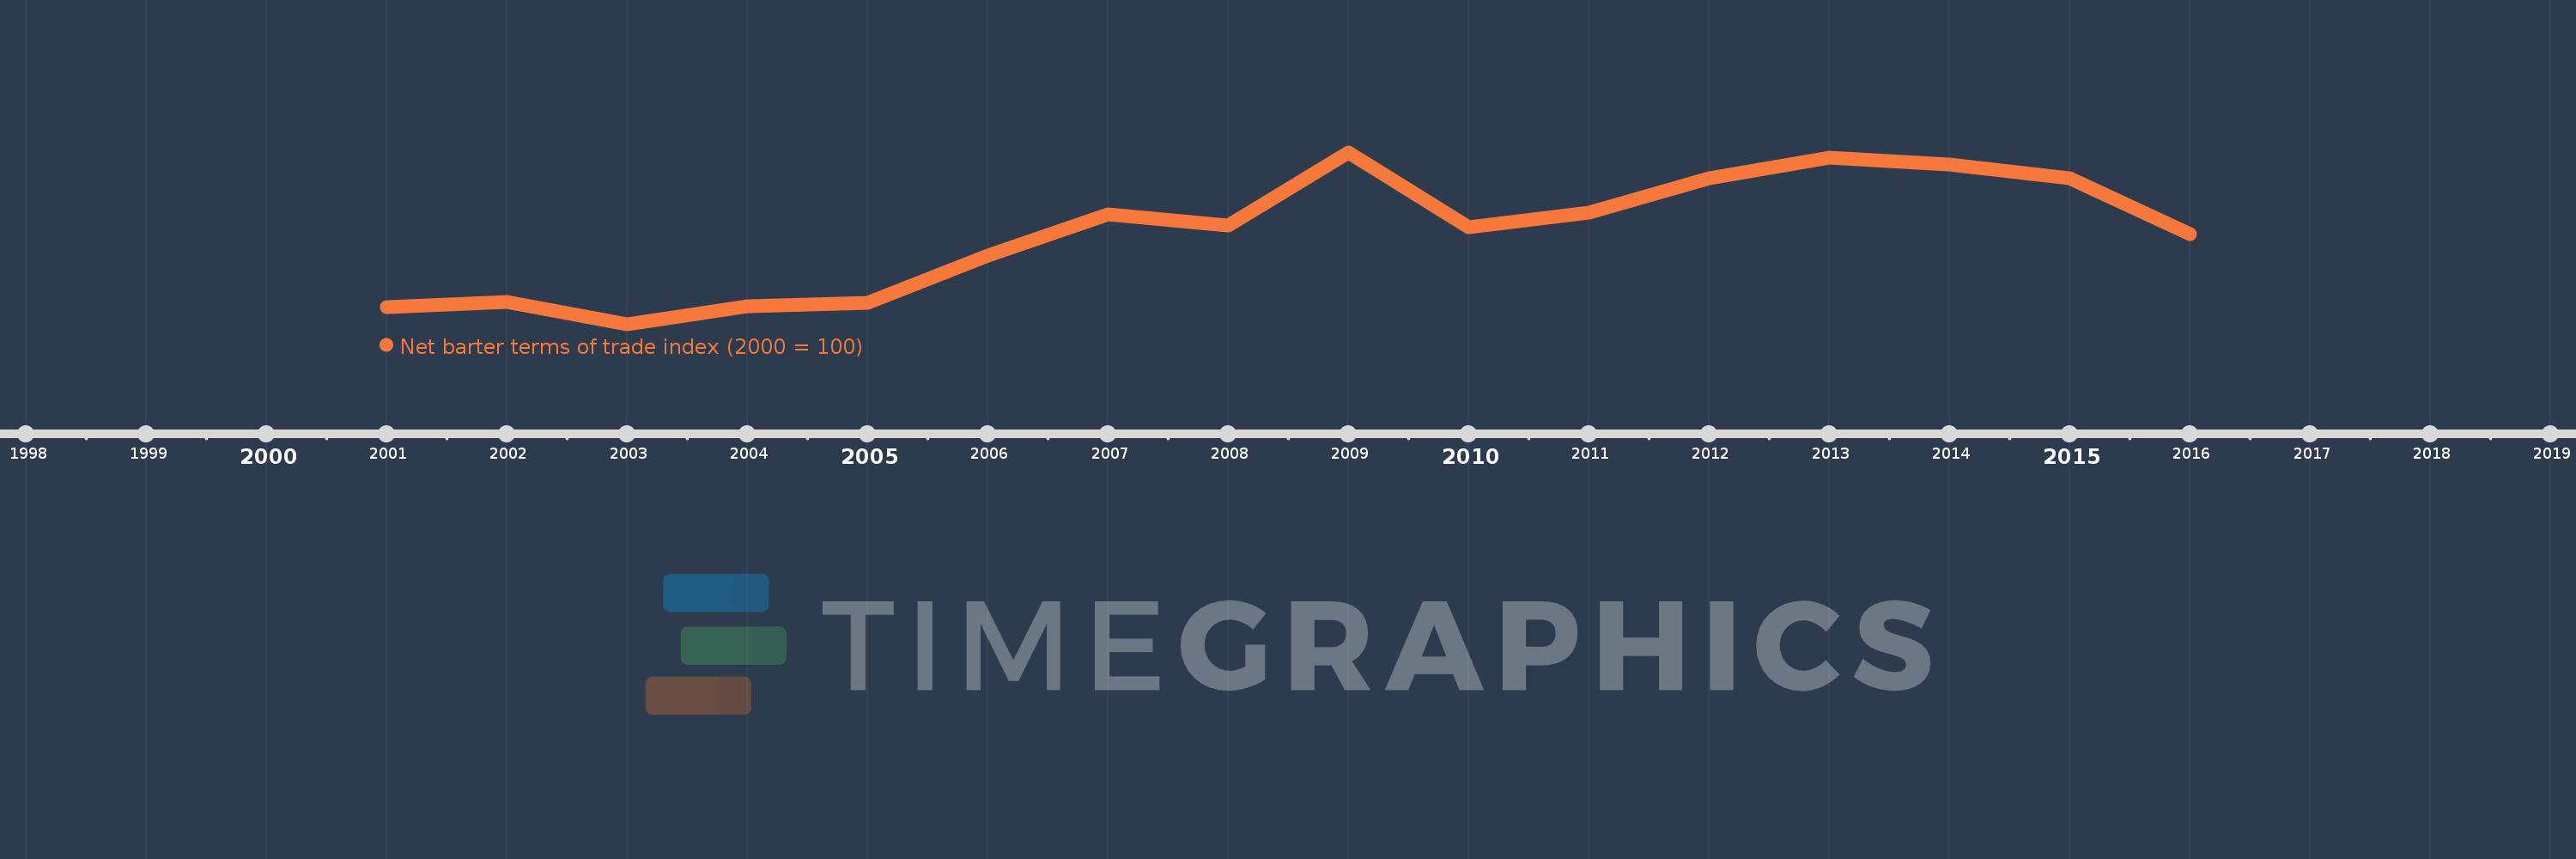
This timeline shows a graph from 2001 to 2016 of Turkmenistan. No data until 2000. Number of actual observations by date: 16.
Source name:
World Development Indicators
Source organization:
United Nations Conference on Trade and Development, Handbook of Statistics and data files, and International Monetary Fund, International Financial Statistics.
Categories, topics:
Private Sector, Trade
Last updated:
apr 23, 2017
Indicators value changes by year
Meaning:
169.683
Minimum:
83.696
jan 1, 2003
Maximum:
247.289
jan 1, 2009
At the date of observation
Value
Absolute change
Change from the previous value
jan 1, 2001
100.0
+100.0
0.0%
jan 1, 2002
105.108
+5.108
5.11%
jan 1, 2003
83.696
-21.412
-20.37%
jan 1, 2004
100.896
+17.2
20.55%
jan 1, 2005
103.705
+2.809
2.78%
jan 1, 2006
149.325
+45.619
43.99%
jan 1, 2007
188.424
+39.099
26.18%
jan 1, 2008
177.899
-10.525
-5.59%
jan 1, 2009
247.289
+69.39
39.01%
jan 1, 2010
175.728
-71.561
-28.94%
jan 1, 2011
189.874
+14.146
8.05%
jan 1, 2012
222.852
+32.978
17.37%
jan 1, 2013
242.34
+19.488
8.74%
jan 1, 2014
235.468
-6.872
-2.84%
jan 1, 2015
222.498
-12.97
-5.51%
jan 1, 2016
169.822
-52.676
-23.67%
Ranking of countries by current statistics by years