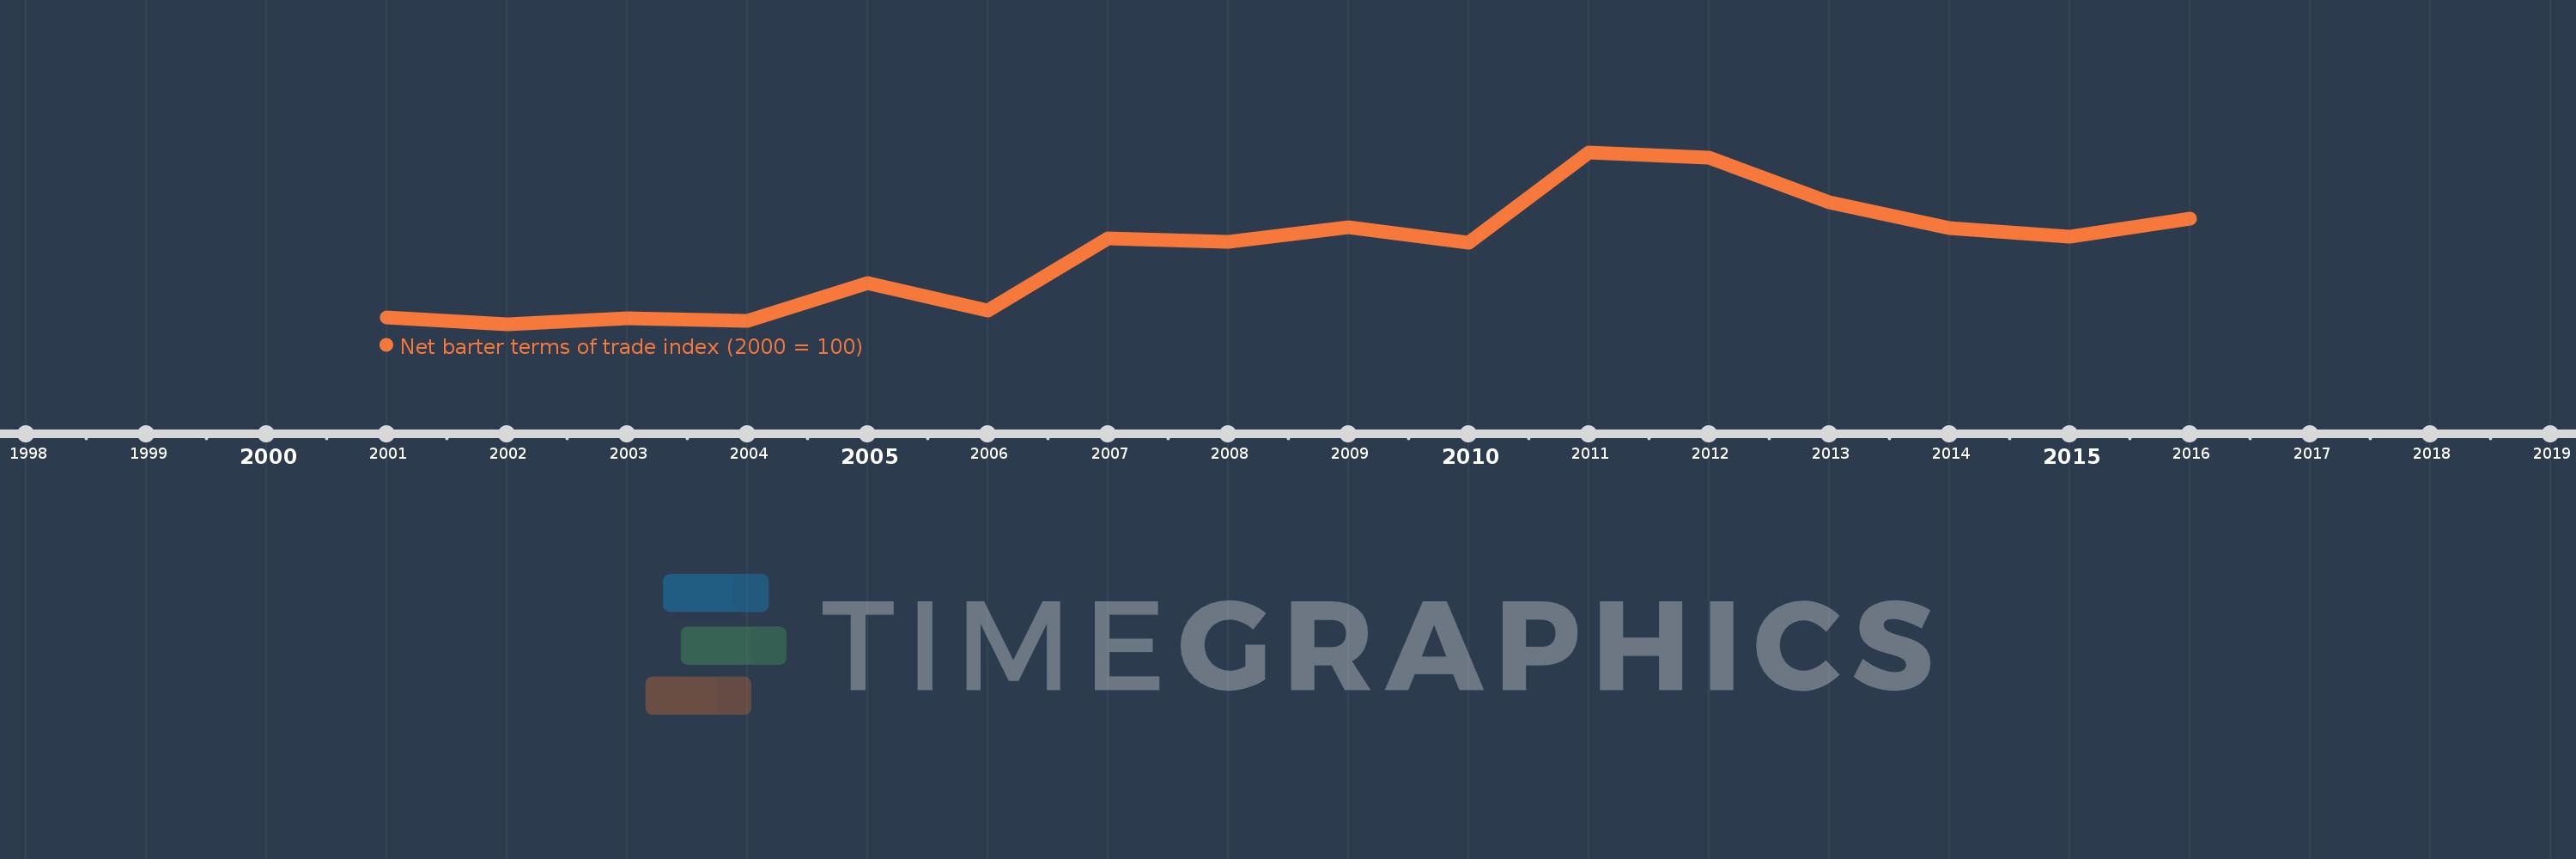
This timeline shows a graph from 2001 to 2016 of Armenia. No data until 2000. Number of actual observations by date: 16.
Source name:
World Development Indicators
Source organization:
United Nations Conference on Trade and Development, Handbook of Statistics and data files, and International Monetary Fund, International Financial Statistics.
Categories, topics:
Private Sector, Trade
Last updated:
apr 23, 2017
Indicators value changes by year
Meaning:
110.782
Minimum:
98.906
jan 1, 2002
Maximum:
126.881
jan 1, 2011
At the date of observation
Value
Absolute change
Change from the previous value
jan 1, 2001
100.0
+100.0
0.0%
jan 1, 2002
98.906
-1.094
-1.09%
jan 1, 2003
99.884
+0.979
0.99%
jan 1, 2004
99.393
-0.491
-0.49%
jan 1, 2005
105.568
+6.175
6.21%
jan 1, 2006
101.116
-4.453
-4.22%
jan 1, 2007
112.848
+11.733
11.6%
jan 1, 2008
112.377
-0.471
-0.42%
jan 1, 2009
114.748
+2.371
2.11%
jan 1, 2010
112.228
-2.52
-2.2%
jan 1, 2011
126.881
+14.653
13.06%
jan 1, 2012
126.017
-0.864
-0.68%
jan 1, 2013
118.778
-7.24
-5.74%
jan 1, 2014
114.605
-4.173
-3.51%
jan 1, 2015
113.124
-1.481
-1.29%
jan 1, 2016
116.034
+2.911
2.57%
Ranking of countries by current statistics by years