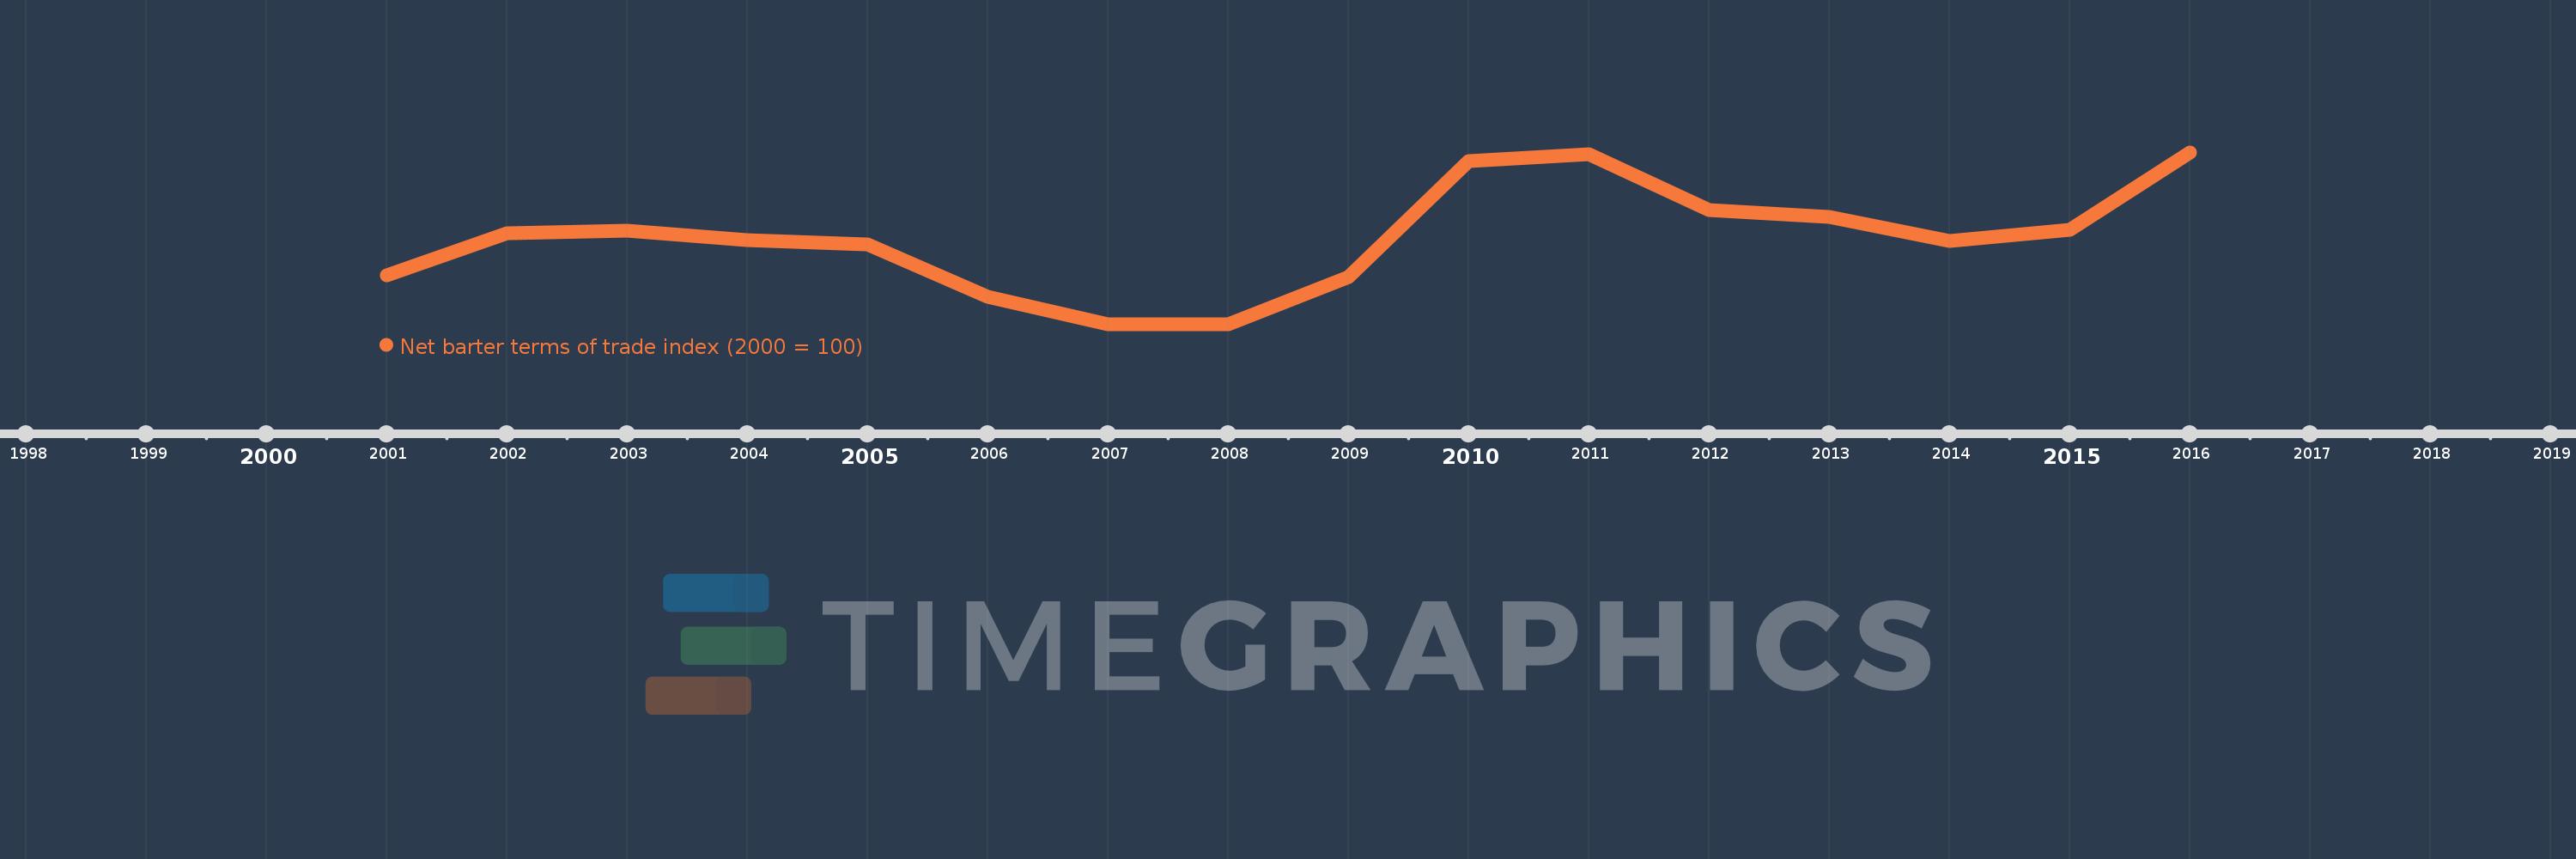
This timeline shows a graph from 2001 to 2016 of Switzerland. No data until 2000. Number of actual observations by date: 16.
Source name:
World Development Indicators
Source organization:
United Nations Conference on Trade and Development, Handbook of Statistics and data files, and International Monetary Fund, International Financial Statistics.
Categories, topics:
Private Sector, Trade
Last updated:
apr 23, 2017
Indicators value changes by year
Meaning:
102.32
Minimum:
96.917
jan 1, 2007
Maximum:
107.708
jan 1, 2016
At the date of observation
Value
Absolute change
Change from the previous value
jan 1, 2001
100.0
+100.0
0.0%
jan 1, 2002
102.613
+2.613
2.61%
jan 1, 2003
102.808
+0.195
0.19%
jan 1, 2004
102.188
-0.62
-0.6%
jan 1, 2005
101.912
-0.275
-0.27%
jan 1, 2006
98.616
-3.297
-3.24%
jan 1, 2007
96.917
-1.699
-1.72%
jan 1, 2008
96.917
0.0
0.0%
jan 1, 2009
99.883
+2.966
3.06%
jan 1, 2010
107.161
+7.278
7.29%
jan 1, 2011
107.574
+0.414
0.39%
jan 1, 2012
104.113
-3.461
-3.22%
jan 1, 2013
103.681
-0.432
-0.42%
jan 1, 2014
102.166
-1.514
-1.46%
jan 1, 2015
102.865
+0.698
0.68%
jan 1, 2016
107.708
+4.843
4.71%
Ranking of countries by current statistics by years