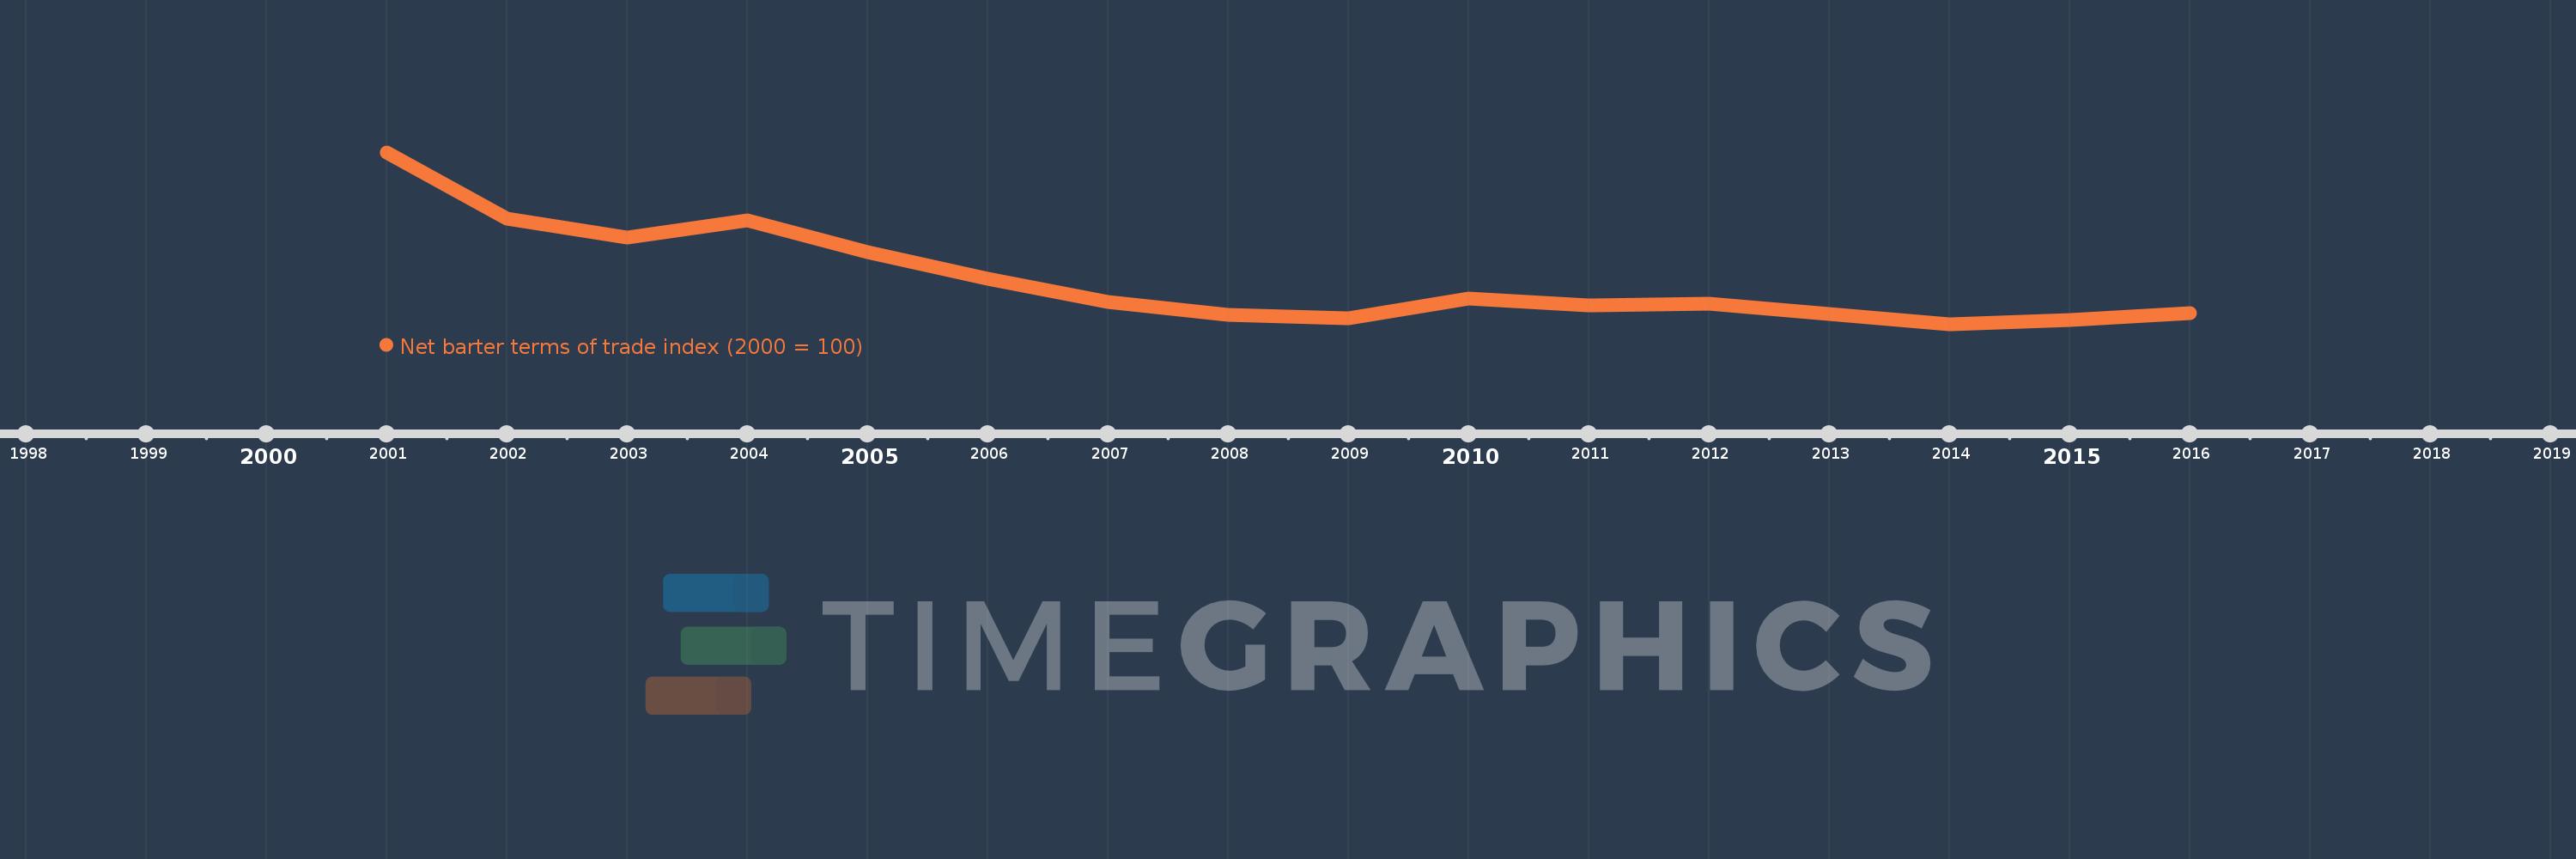
This timeline shows a graph from 2001 to 2016 of Turks and Caicos Islands. No data until 2000. Number of actual observations by date: 16.
Source name:
World Development Indicators
Source organization:
United Nations Conference on Trade and Development, Handbook of Statistics and data files, and International Monetary Fund, International Financial Statistics.
Categories, topics:
Private Sector, Trade
Last updated:
apr 23, 2017
Indicators value changes by year
Meaning:
77.853
Minimum:
70.114
jan 1, 2014
Maximum:
100.0
jan 1, 2001
At the date of observation
Value
Absolute change
Change from the previous value
jan 1, 2001
100.0
+100.0
0.0%
jan 1, 2002
88.424
-11.576
-11.58%
jan 1, 2003
85.179
-3.246
-3.67%
jan 1, 2004
88.175
+2.996
3.52%
jan 1, 2005
82.649
-5.526
-6.27%
jan 1, 2006
77.989
-4.66
-5.64%
jan 1, 2007
73.976
-4.013
-5.15%
jan 1, 2008
71.778
-2.198
-2.97%
jan 1, 2009
71.203
-0.575
-0.8%
jan 1, 2010
74.555
+3.352
4.71%
jan 1, 2011
73.313
-1.242
-1.67%
jan 1, 2012
73.697
+0.384
0.52%
jan 1, 2013
71.836
-1.861
-2.53%
jan 1, 2014
70.114
-1.722
-2.4%
jan 1, 2015
70.781
+0.668
0.95%
jan 1, 2016
71.986
+1.205
1.7%
Ranking of countries by current statistics by years