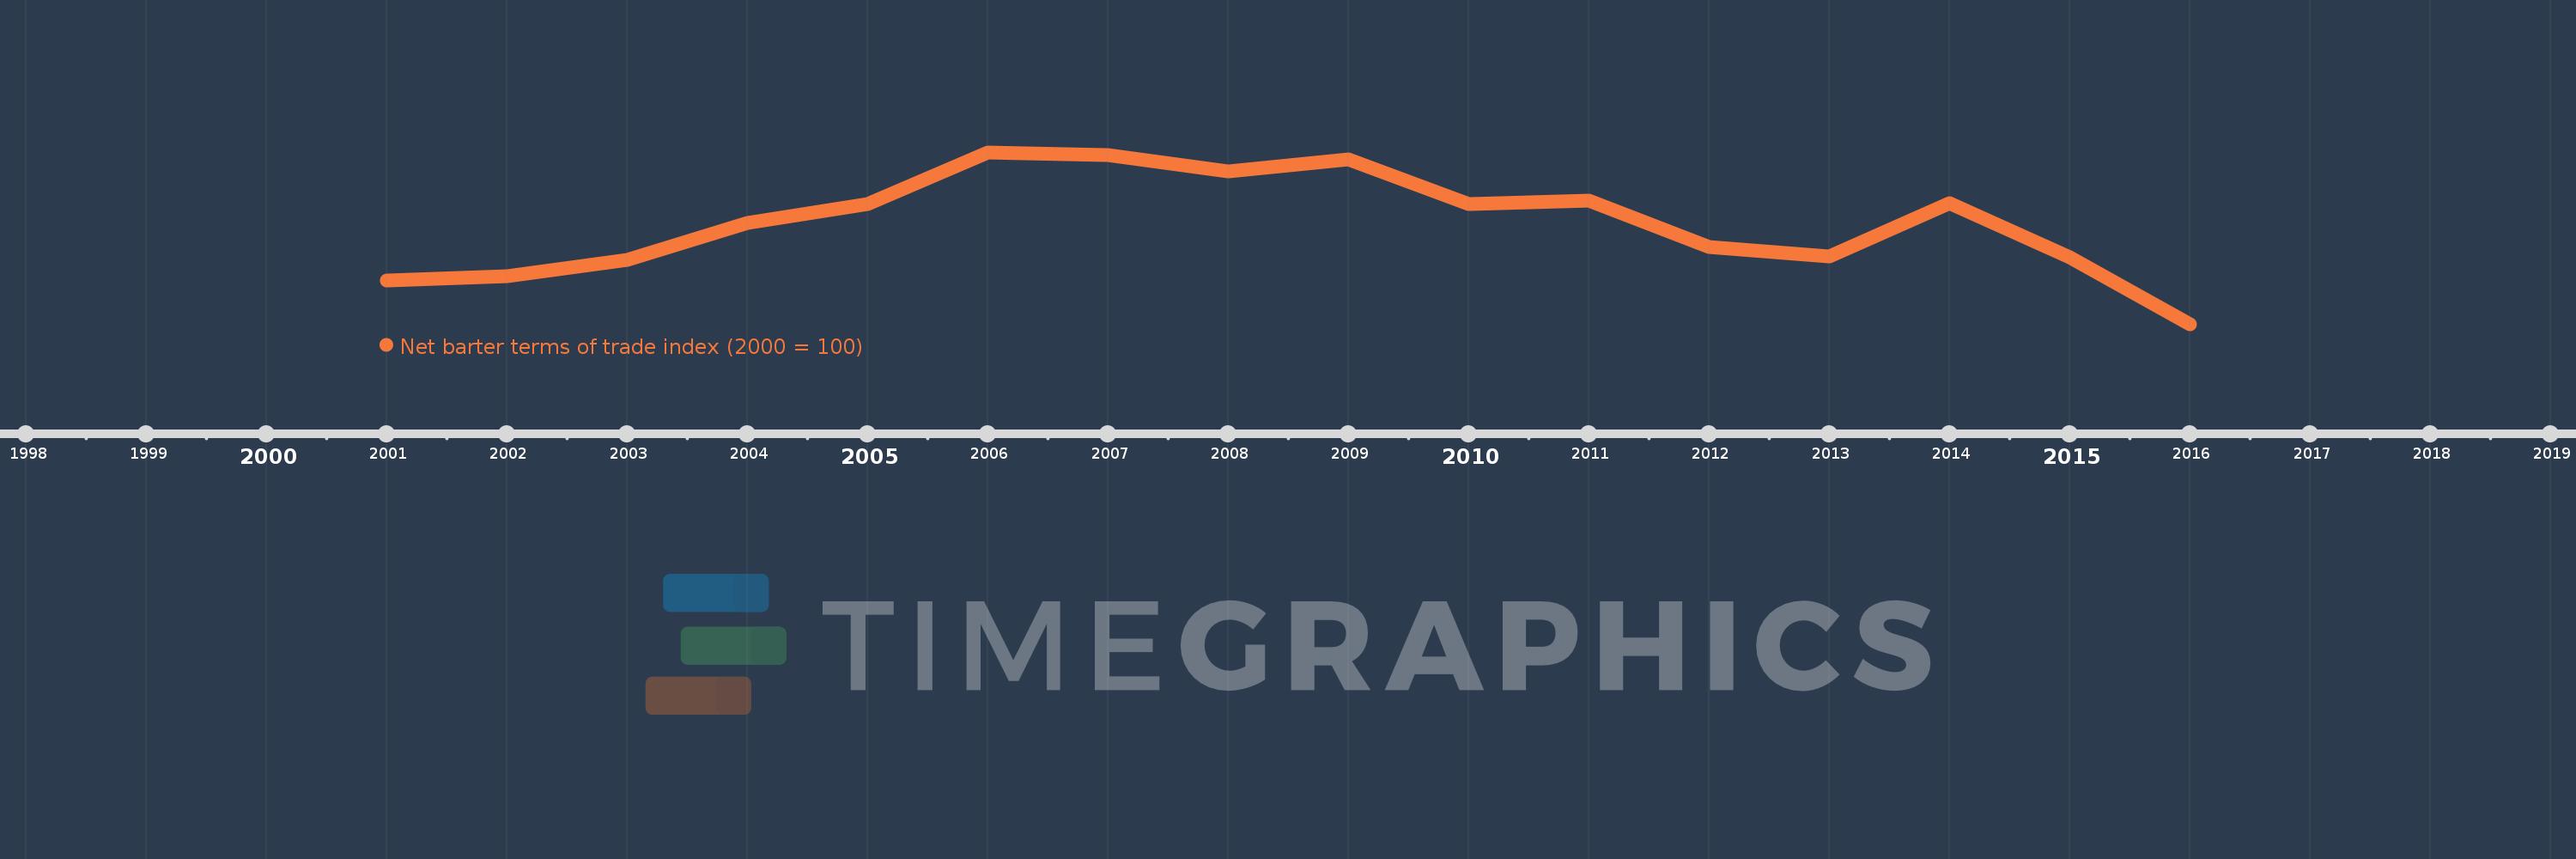
This timeline shows a graph from 2001 to 2016 of United Kingdom. No data until 2000. Number of actual observations by date: 16.
Source name:
World Development Indicators
Source organization:
United Nations Conference on Trade and Development, Handbook of Statistics and data files, and International Monetary Fund, International Financial Statistics.
Categories, topics:
Private Sector, Trade
Last updated:
apr 23, 2017
Indicators value changes by year
Meaning:
101.984
Minimum:
98.488
jan 1, 2016
Maximum:
104.443
jan 1, 2006
At the date of observation
Value
Absolute change
Change from the previous value
jan 1, 2001
100.0
+100.0
0.0%
jan 1, 2002
100.143
+0.143
0.14%
jan 1, 2003
100.716
+0.573
0.57%
jan 1, 2004
102.013
+1.297
1.29%
jan 1, 2005
102.657
+0.644
0.63%
jan 1, 2006
104.443
+1.786
1.74%
jan 1, 2007
104.355
-0.087
-0.08%
jan 1, 2008
103.78
-0.575
-0.55%
jan 1, 2009
104.191
+0.41
0.4%
jan 1, 2010
102.667
-1.523
-1.46%
jan 1, 2011
102.781
+0.114
0.11%
jan 1, 2012
101.177
-1.604
-1.56%
jan 1, 2013
100.842
-0.335
-0.33%
jan 1, 2014
102.69
+1.849
1.83%
jan 1, 2015
100.805
-1.886
-1.84%
jan 1, 2016
98.488
-2.317
-2.3%
Ranking of countries by current statistics by years