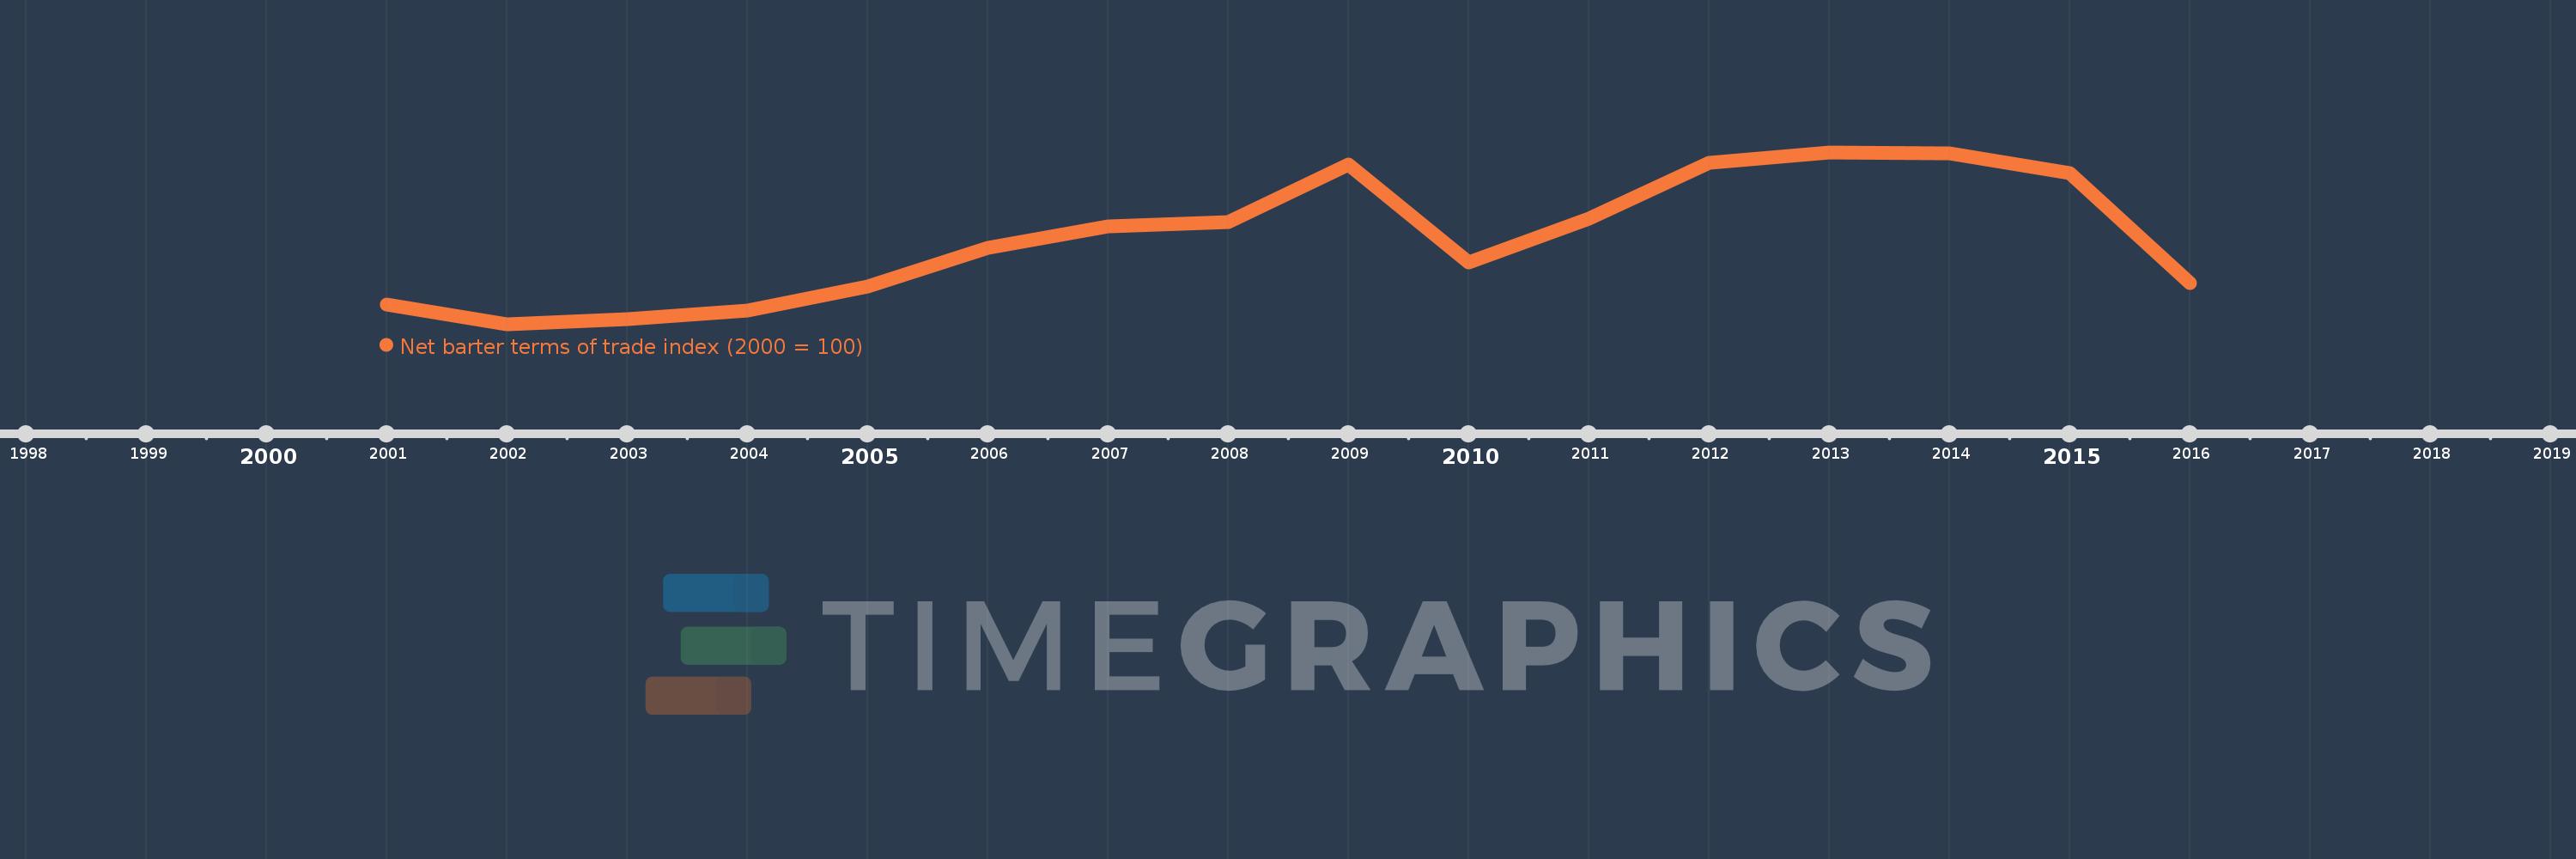
This timeline shows a graph from 2001 to 2016 of Azerbaijan. No data until 2000. Number of actual observations by date: 16.
Source name:
World Development Indicators
Source organization:
United Nations Conference on Trade and Development, Handbook of Statistics and data files, and International Monetary Fund, International Financial Statistics.
Categories, topics:
Private Sector, Trade
Last updated:
apr 23, 2017
Indicators value changes by year
Meaning:
142.651
Minimum:
87.141
jan 1, 2002
Maximum:
198.019
jan 1, 2013
At the date of observation
Value
Absolute change
Change from the previous value
jan 1, 2001
100.0
+100.0
0.0%
jan 1, 2002
87.141
-12.859
-12.86%
jan 1, 2003
90.184
+3.043
3.49%
jan 1, 2004
95.953
+5.768
6.4%
jan 1, 2005
111.594
+15.641
16.3%
jan 1, 2006
136.59
+24.996
22.4%
jan 1, 2007
150.322
+13.733
10.05%
jan 1, 2008
153.127
+2.804
1.87%
jan 1, 2009
190.052
+36.925
24.11%
jan 1, 2010
127.072
-62.98
-33.14%
jan 1, 2011
155.362
+28.29
22.26%
jan 1, 2012
191.436
+36.074
23.22%
jan 1, 2013
198.019
+6.583
3.44%
jan 1, 2014
197.357
-0.662
-0.33%
jan 1, 2015
184.404
-12.952
-6.56%
jan 1, 2016
113.802
-70.603
-38.29%
Ranking of countries by current statistics by years