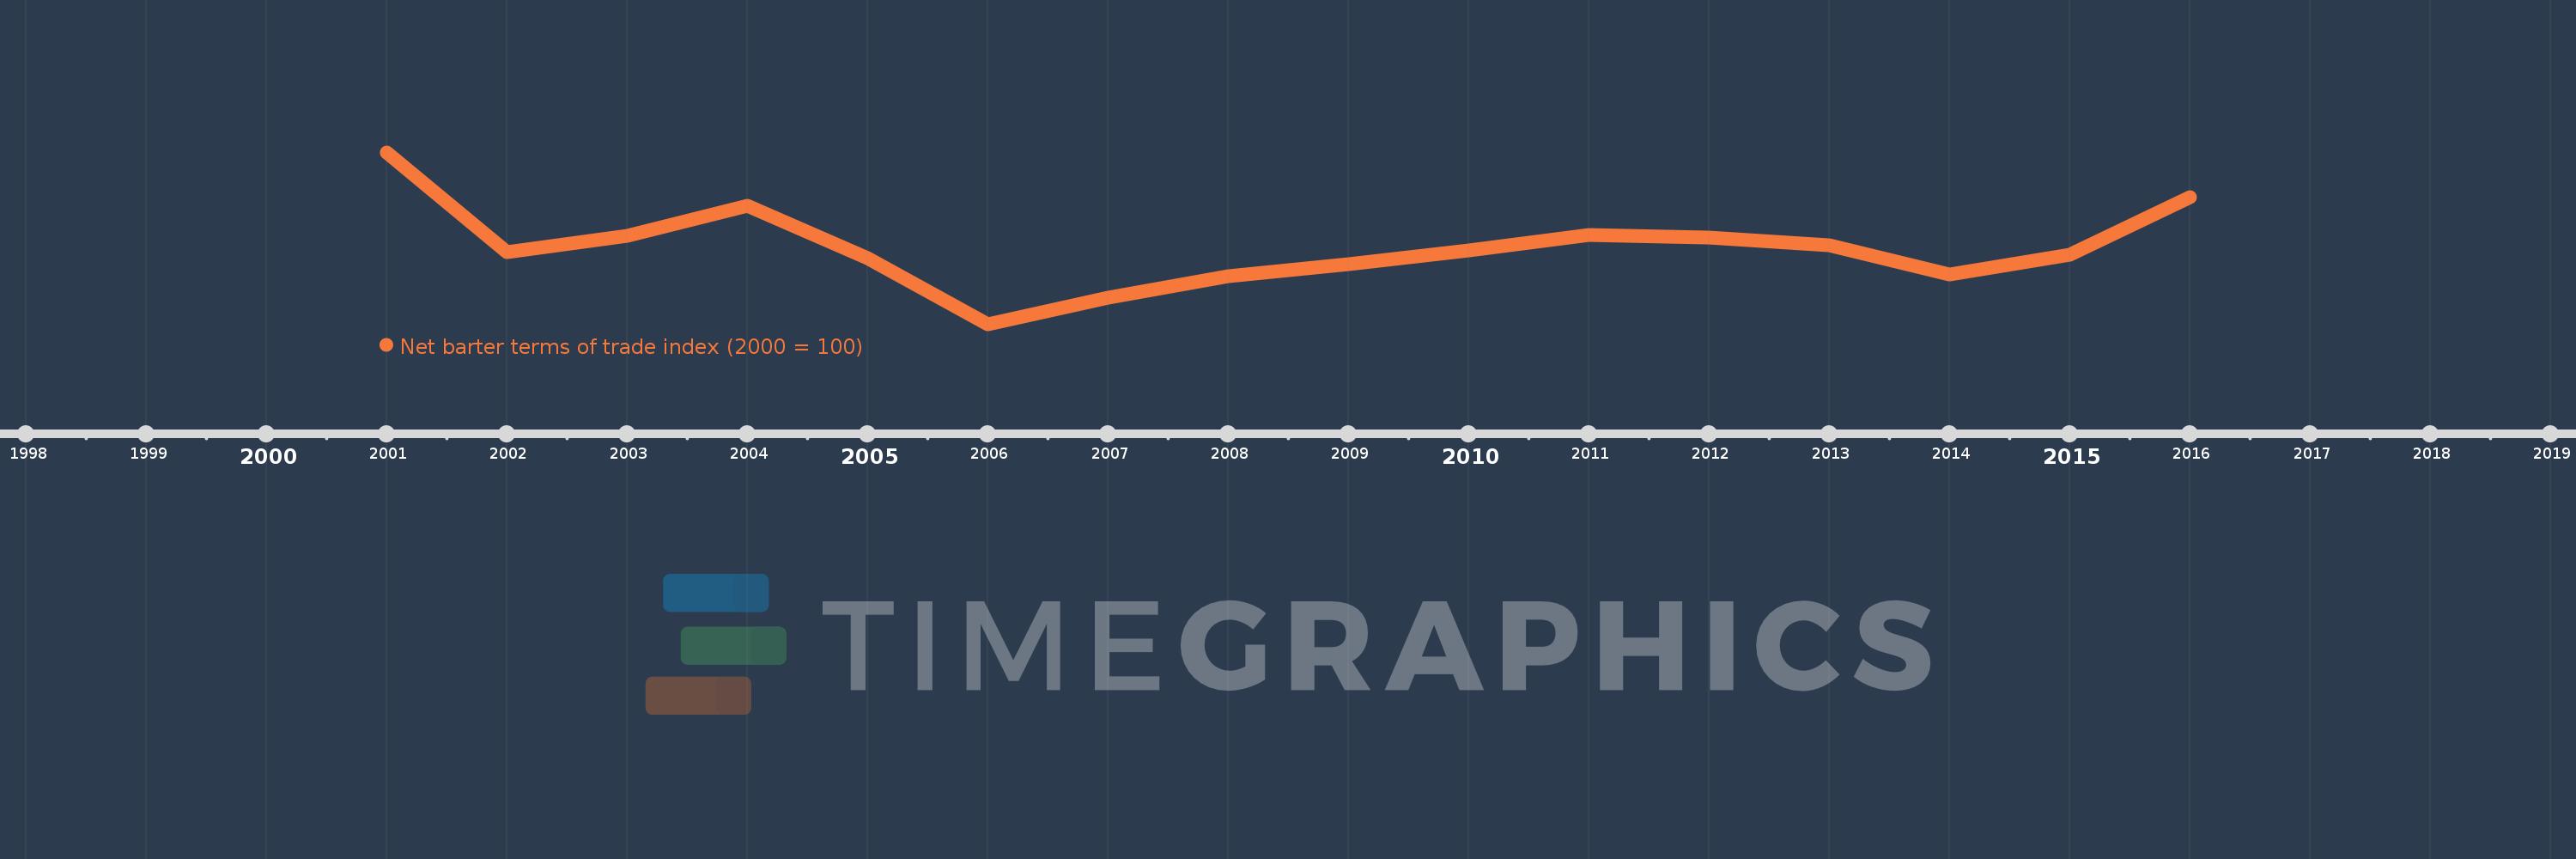
This timeline shows a graph from 2001 to 2016 of Grenada. No data until 2000. Number of actual observations by date: 16.
Source name:
World Development Indicators
Source organization:
United Nations Conference on Trade and Development, Handbook of Statistics and data files, and International Monetary Fund, International Financial Statistics.
Categories, topics:
Private Sector, Trade
Last updated:
apr 23, 2017
Indicators value changes by year
Meaning:
88.814
Minimum:
79.784
jan 1, 2006
Maximum:
100.0
jan 1, 2001
At the date of observation
Value
Absolute change
Change from the previous value
jan 1, 2001
100.0
+100.0
0.0%
jan 1, 2002
88.303
-11.697
-11.7%
jan 1, 2003
90.177
+1.874
2.12%
jan 1, 2004
93.674
+3.497
3.88%
jan 1, 2005
87.533
-6.142
-6.56%
jan 1, 2006
79.784
-7.748
-8.85%
jan 1, 2007
82.912
+3.128
3.92%
jan 1, 2008
85.47
+2.558
3.08%
jan 1, 2009
86.845
+1.374
1.61%
jan 1, 2010
88.466
+1.622
1.87%
jan 1, 2011
90.311
+1.845
2.09%
jan 1, 2012
90.028
-0.283
-0.31%
jan 1, 2013
89.119
-0.909
-1.01%
jan 1, 2014
85.683
-3.435
-3.85%
jan 1, 2015
87.976
+2.293
2.68%
jan 1, 2016
94.747
+6.771
7.7%
Ranking of countries by current statistics by years