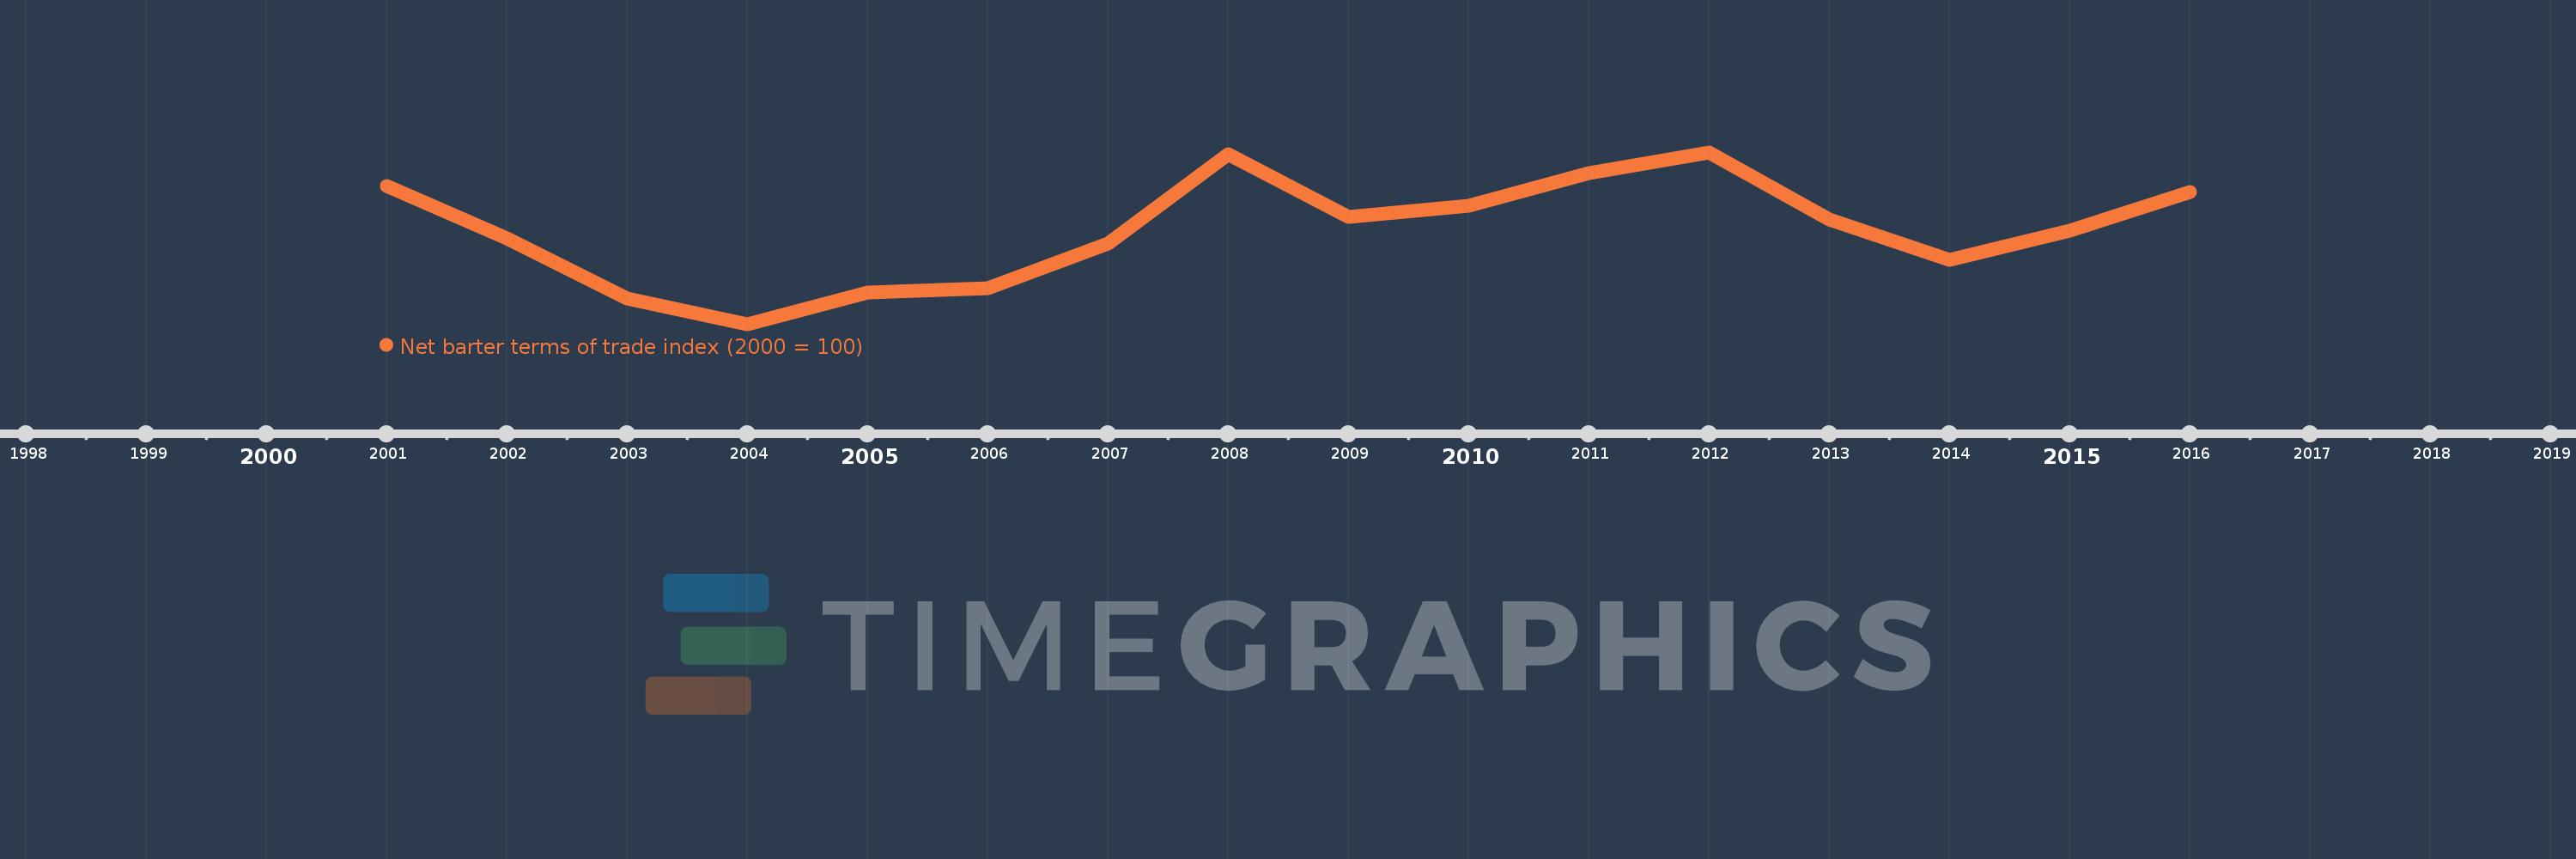
This timeline shows a graph from 2001 to 2016 of Croatia. No data until 2000. Number of actual observations by date: 16.
Source name:
World Development Indicators
Source organization:
United Nations Conference on Trade and Development, Handbook of Statistics and data files, and International Monetary Fund, International Financial Statistics.
Categories, topics:
Private Sector, Trade
Last updated:
apr 23, 2017
Indicators value changes by year
Meaning:
99.044
Minimum:
96.994
jan 1, 2004
Maximum:
100.722
jan 1, 2012
At the date of observation
Value
Absolute change
Change from the previous value
jan 1, 2001
100.0
+100.0
0.0%
jan 1, 2002
98.856
-1.144
-1.14%
jan 1, 2003
97.555
-1.301
-1.32%
jan 1, 2004
96.994
-0.561
-0.57%
jan 1, 2005
97.678
+0.683
0.7%
jan 1, 2006
97.774
+0.096
0.1%
jan 1, 2007
98.753
+0.979
1.0%
jan 1, 2008
100.683
+1.93
1.95%
jan 1, 2009
99.322
-1.361
-1.35%
jan 1, 2010
99.561
+0.238
0.24%
jan 1, 2011
100.273
+0.713
0.72%
jan 1, 2012
100.722
+0.448
0.45%
jan 1, 2013
99.269
-1.452
-1.44%
jan 1, 2014
98.383
-0.886
-0.89%
jan 1, 2015
99.024
+0.641
0.65%
jan 1, 2016
99.856
+0.832
0.84%
Ranking of countries by current statistics by years