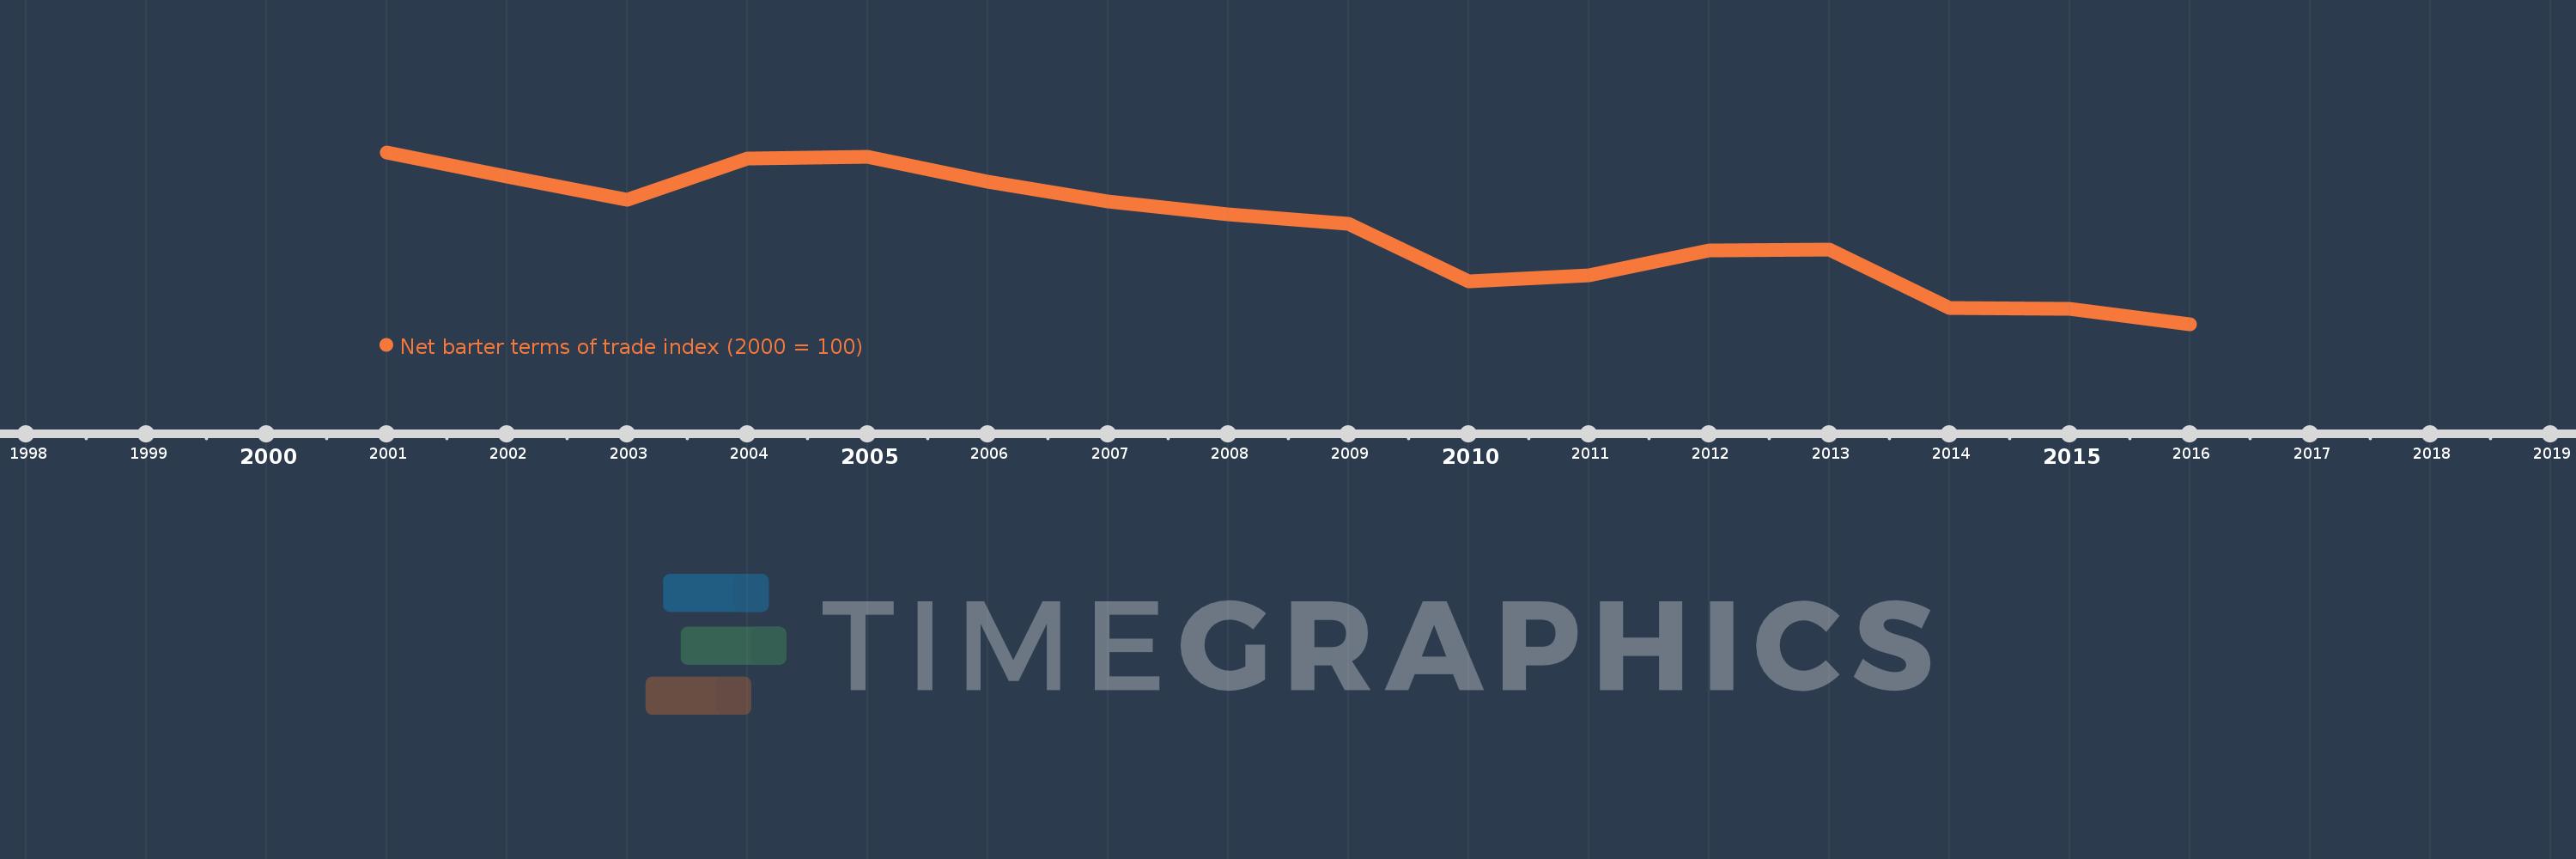
This timeline shows a graph from 2001 to 2016 of Bahamas, The. No data until 2000. Number of actual observations by date: 16.
Source name:
World Development Indicators
Source organization:
United Nations Conference on Trade and Development, Handbook of Statistics and data files, and International Monetary Fund, International Financial Statistics.
Categories, topics:
Private Sector, Trade
Last updated:
apr 23, 2017
Indicators value changes by year
Meaning:
89.303
Minimum:
75.985
jan 1, 2016
Maximum:
100.0
jan 1, 2001
At the date of observation
Value
Absolute change
Change from the previous value
jan 1, 2001
100.0
+100.0
0.0%
jan 1, 2002
96.668
-3.332
-3.33%
jan 1, 2003
93.345
-3.323
-3.44%
jan 1, 2004
99.175
+5.83
6.25%
jan 1, 2005
99.343
+0.168
0.17%
jan 1, 2006
95.926
-3.418
-3.44%
jan 1, 2007
93.169
-2.757
-2.87%
jan 1, 2008
91.32
-1.849
-1.98%
jan 1, 2009
90.049
-1.27
-1.39%
jan 1, 2010
81.951
-8.099
-8.99%
jan 1, 2011
82.868
+0.917
1.12%
jan 1, 2012
86.274
+3.406
4.11%
jan 1, 2013
86.381
+0.107
0.12%
jan 1, 2014
78.254
-8.126
-9.41%
jan 1, 2015
78.148
-0.107
-0.14%
jan 1, 2016
75.985
-2.163
-2.77%
Ranking of countries by current statistics by years