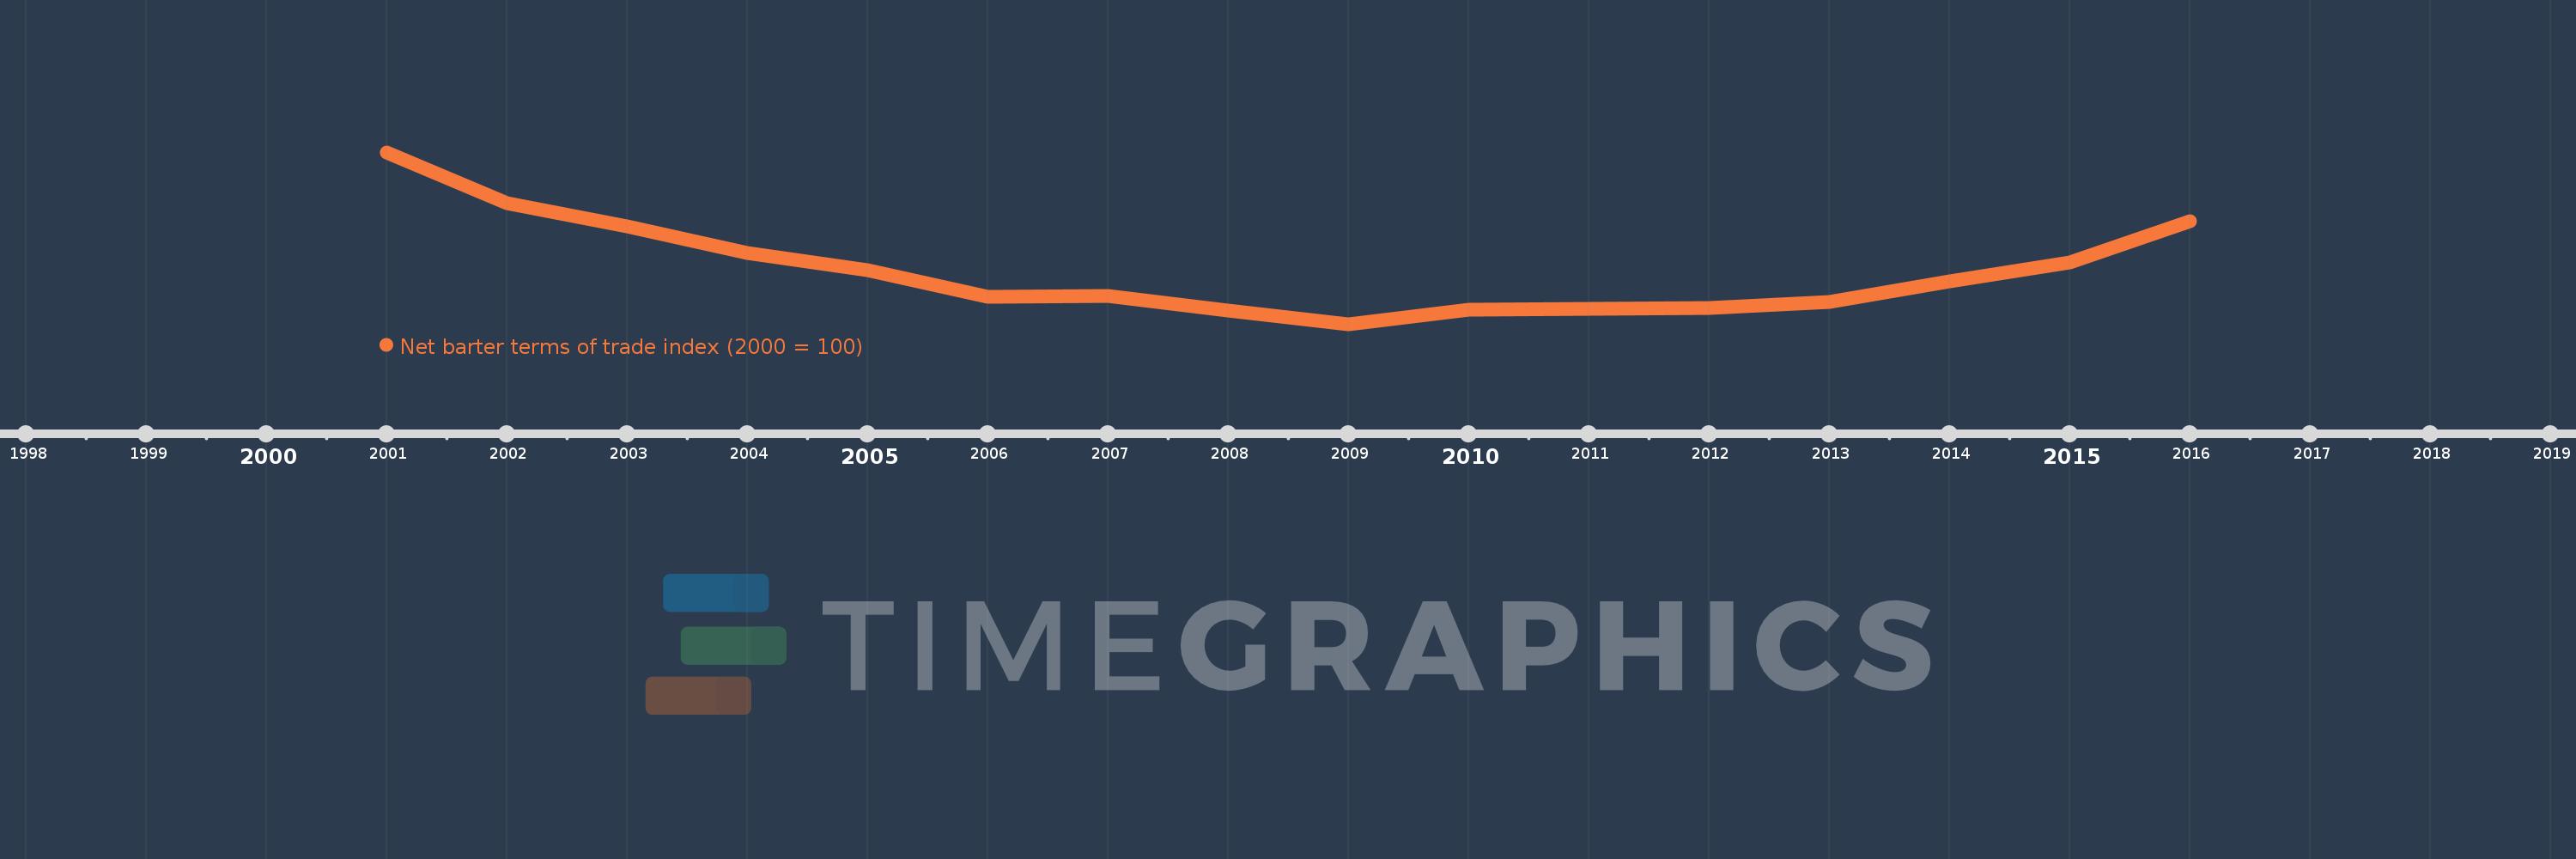
This timeline shows a graph from 2001 to 2016 of Greenland. No data until 2000. Number of actual observations by date: 16.
Source name:
World Development Indicators
Source organization:
United Nations Conference on Trade and Development, Handbook of Statistics and data files, and International Monetary Fund, International Financial Statistics.
Categories, topics:
Private Sector, Trade
Last updated:
apr 23, 2017
Indicators value changes by year
Meaning:
79.165
Minimum:
69.648
jan 1, 2009
Maximum:
100.0
jan 1, 2001
At the date of observation
Value
Absolute change
Change from the previous value
jan 1, 2001
100.0
+100.0
0.0%
jan 1, 2002
91.106
-8.894
-8.89%
jan 1, 2003
86.867
-4.239
-4.65%
jan 1, 2004
82.279
-4.588
-5.28%
jan 1, 2005
79.188
-3.09
-3.76%
jan 1, 2006
74.424
-4.765
-6.02%
jan 1, 2007
74.604
+0.181
0.24%
jan 1, 2008
72.097
-2.507
-3.36%
jan 1, 2009
69.648
-2.449
-3.4%
jan 1, 2010
72.234
+2.586
3.71%
jan 1, 2011
72.368
+0.134
0.19%
jan 1, 2012
72.538
+0.17
0.24%
jan 1, 2013
73.612
+1.074
1.48%
jan 1, 2014
77.246
+3.633
4.94%
jan 1, 2015
80.515
+3.269
4.23%
jan 1, 2016
87.916
+7.402
9.19%
Ranking of countries by current statistics by years