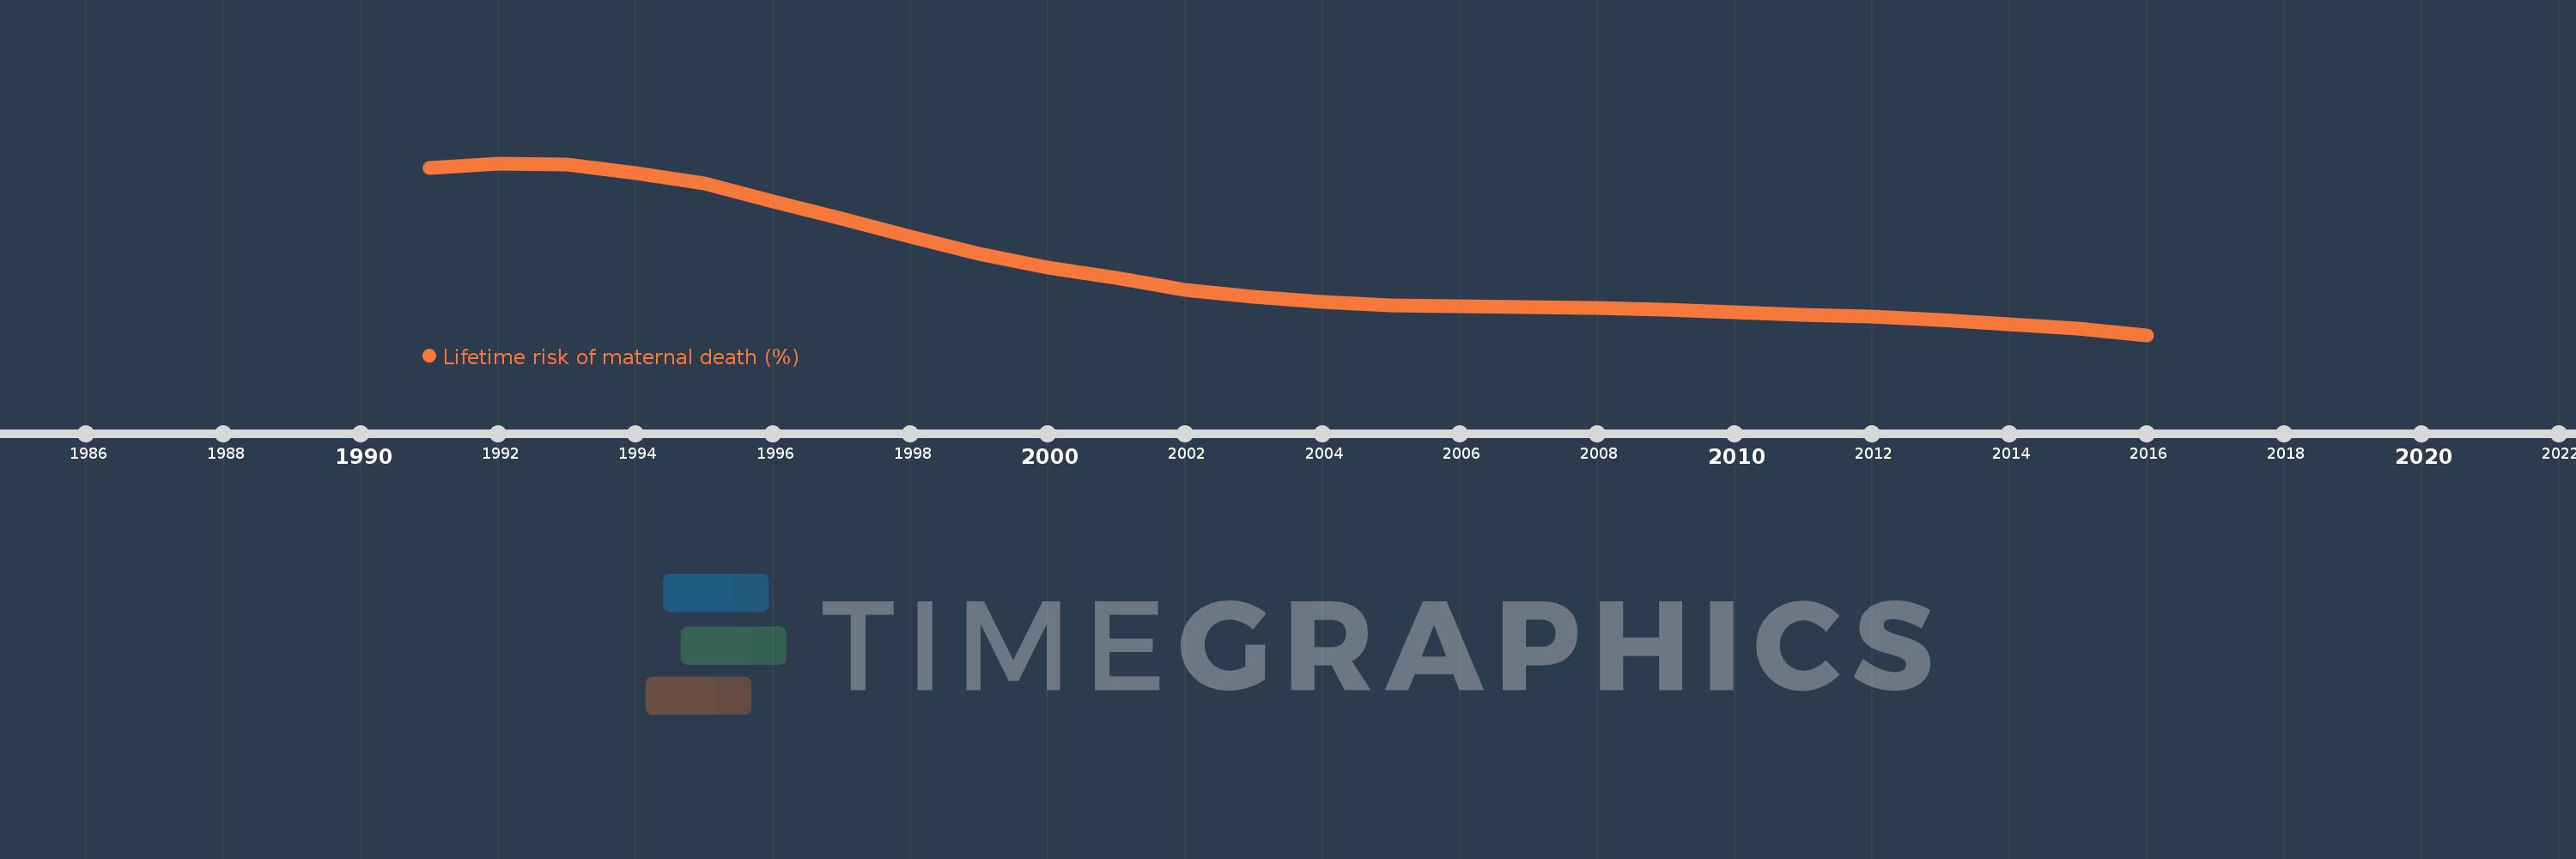
This timeline shows a graph from 1991 to 2016 of Burundi. No data until 1990. Number of actual observations by date: 26.
Source name:
World Development Indicators
Source organization:
WHO, UNICEF, UNFPA, The World Bank, and the United Nations Population Division. Trends in Maternal Mortality: 1990 to 2015. Geneva, World Health Organization, 2015
Categories, topics:
Health, Gender
Last updated:
apr 23, 2017
Indicators value changes by year
Meaning:
5.984
Minimum:
4.273
jan 1, 2016
Maximum:
8.706
jan 1, 1992
At the date of observation
Value
Absolute change
Change from the previous value
jan 1, 1991
8.59
+8.59
0.0%
jan 1, 1992
8.706
+0.116
1.35%
jan 1, 1993
8.662
-0.044
-0.51%
jan 1, 1994
8.458
-0.204
-2.36%
jan 1, 1995
8.176
-0.281
-3.33%
jan 1, 1996
7.715
-0.462
-5.65%
jan 1, 1997
7.268
-0.446
-5.78%
jan 1, 1998
6.811
-0.458
-6.3%
jan 1, 1999
6.369
-0.442
-6.48%
jan 1, 2000
6.003
-0.367
-5.76%
jan 1, 2001
5.738
-0.265
-4.41%
jan 1, 2002
5.447
-0.291
-5.08%
jan 1, 2003
5.251
-0.195
-3.58%
jan 1, 2004
5.117
-0.134
-2.56%
jan 1, 2005
5.046
-0.071
-1.38%
jan 1, 2006
5.006
-0.04
-0.79%
jan 1, 2007
4.989
-0.018
-0.35%
jan 1, 2008
4.969
-0.02
-0.39%
jan 1, 2009
4.928
-0.041
-0.82%
jan 1, 2010
4.869
-0.06
-1.21%
jan 1, 2011
4.783
-0.086
-1.76%
jan 1, 2012
4.742
-0.041
-0.87%
jan 1, 2013
4.665
-0.077
-1.62%
jan 1, 2014
4.559
-0.106
-2.27%
jan 1, 2015
4.431
-0.128
-2.8%
jan 1, 2016
4.273
-0.158
-3.57%
Ranking of countries by current statistics by years