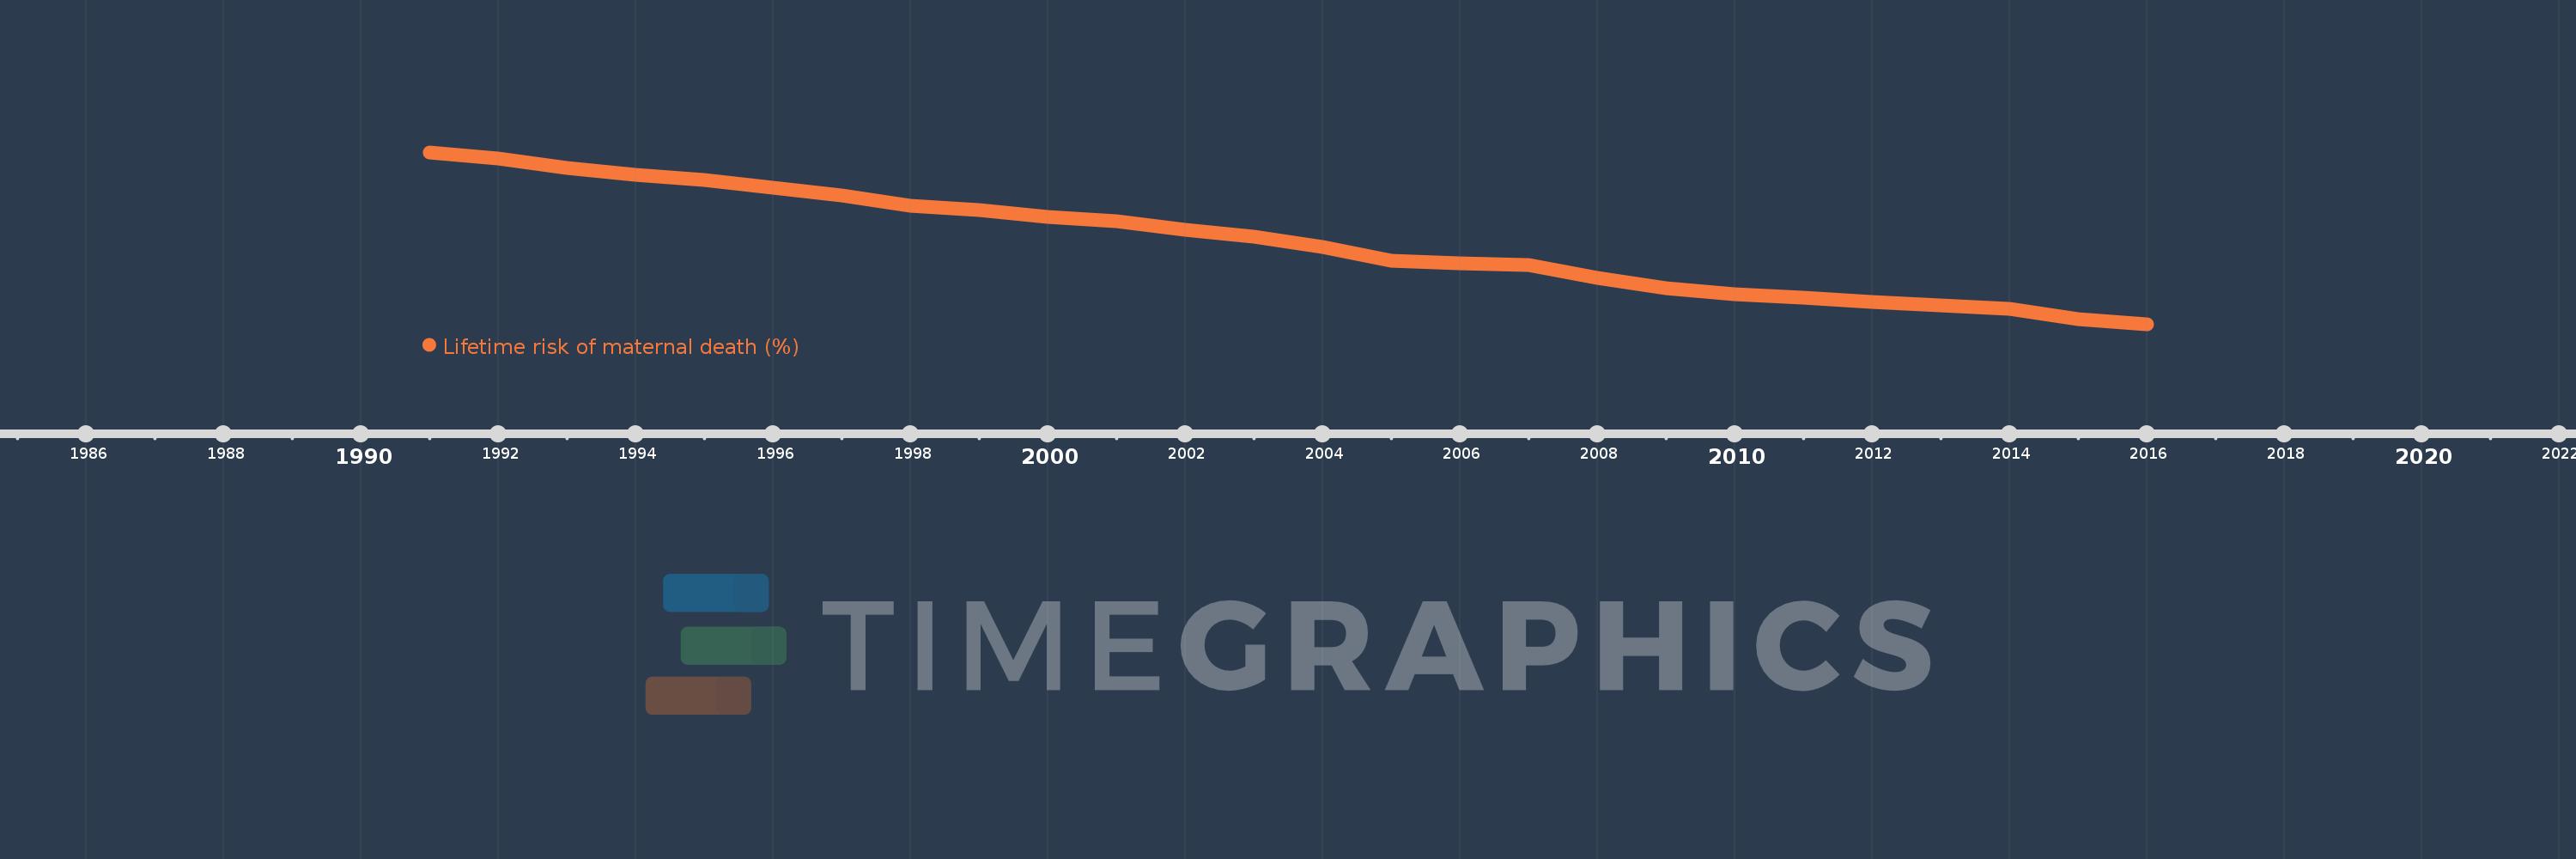
This timeline shows a graph from 1991 to 2016 of Gabon. No data until 1990. Number of actual observations by date: 26.
Source name:
World Development Indicators
Source organization:
WHO, UNICEF, UNFPA, The World Bank, and the United Nations Population Division. Trends in Maternal Mortality: 1990 to 2015. Geneva, World Health Organization, 2015
Categories, topics:
Health, Gender
Last updated:
apr 23, 2017
Indicators value changes by year
Meaning:
1.769
Minimum:
1.174
jan 1, 2016
Maximum:
2.417
jan 1, 1991
At the date of observation
Value
Absolute change
Change from the previous value
jan 1, 1991
2.417
+2.417
0.0%
jan 1, 1992
2.373
-0.044
-1.83%
jan 1, 1993
2.302
-0.071
-3.0%
jan 1, 1994
2.256
-0.045
-1.97%
jan 1, 1995
2.218
-0.038
-1.69%
jan 1, 1996
2.162
-0.056
-2.54%
jan 1, 1997
2.105
-0.057
-2.64%
jan 1, 1998
2.029
-0.075
-3.58%
jan 1, 1999
1.999
-0.03
-1.49%
jan 1, 2000
1.953
-0.046
-2.31%
jan 1, 2001
1.917
-0.036
-1.84%
jan 1, 2002
1.859
-0.057
-3.0%
jan 1, 2003
1.807
-0.052
-2.81%
jan 1, 2004
1.732
-0.075
-4.15%
jan 1, 2005
1.634
-0.099
-5.69%
jan 1, 2006
1.616
-0.017
-1.07%
jan 1, 2007
1.601
-0.016
-0.97%
jan 1, 2008
1.511
-0.09
-5.62%
jan 1, 2009
1.434
-0.077
-5.09%
jan 1, 2010
1.39
-0.044
-3.05%
jan 1, 2011
1.368
-0.023
-1.62%
jan 1, 2012
1.337
-0.03
-2.23%
jan 1, 2013
1.313
-0.024
-1.77%
jan 1, 2014
1.287
-0.026
-1.98%
jan 1, 2015
1.213
-0.075
-5.81%
jan 1, 2016
1.174
-0.039
-3.19%
Ranking of countries by current statistics by years