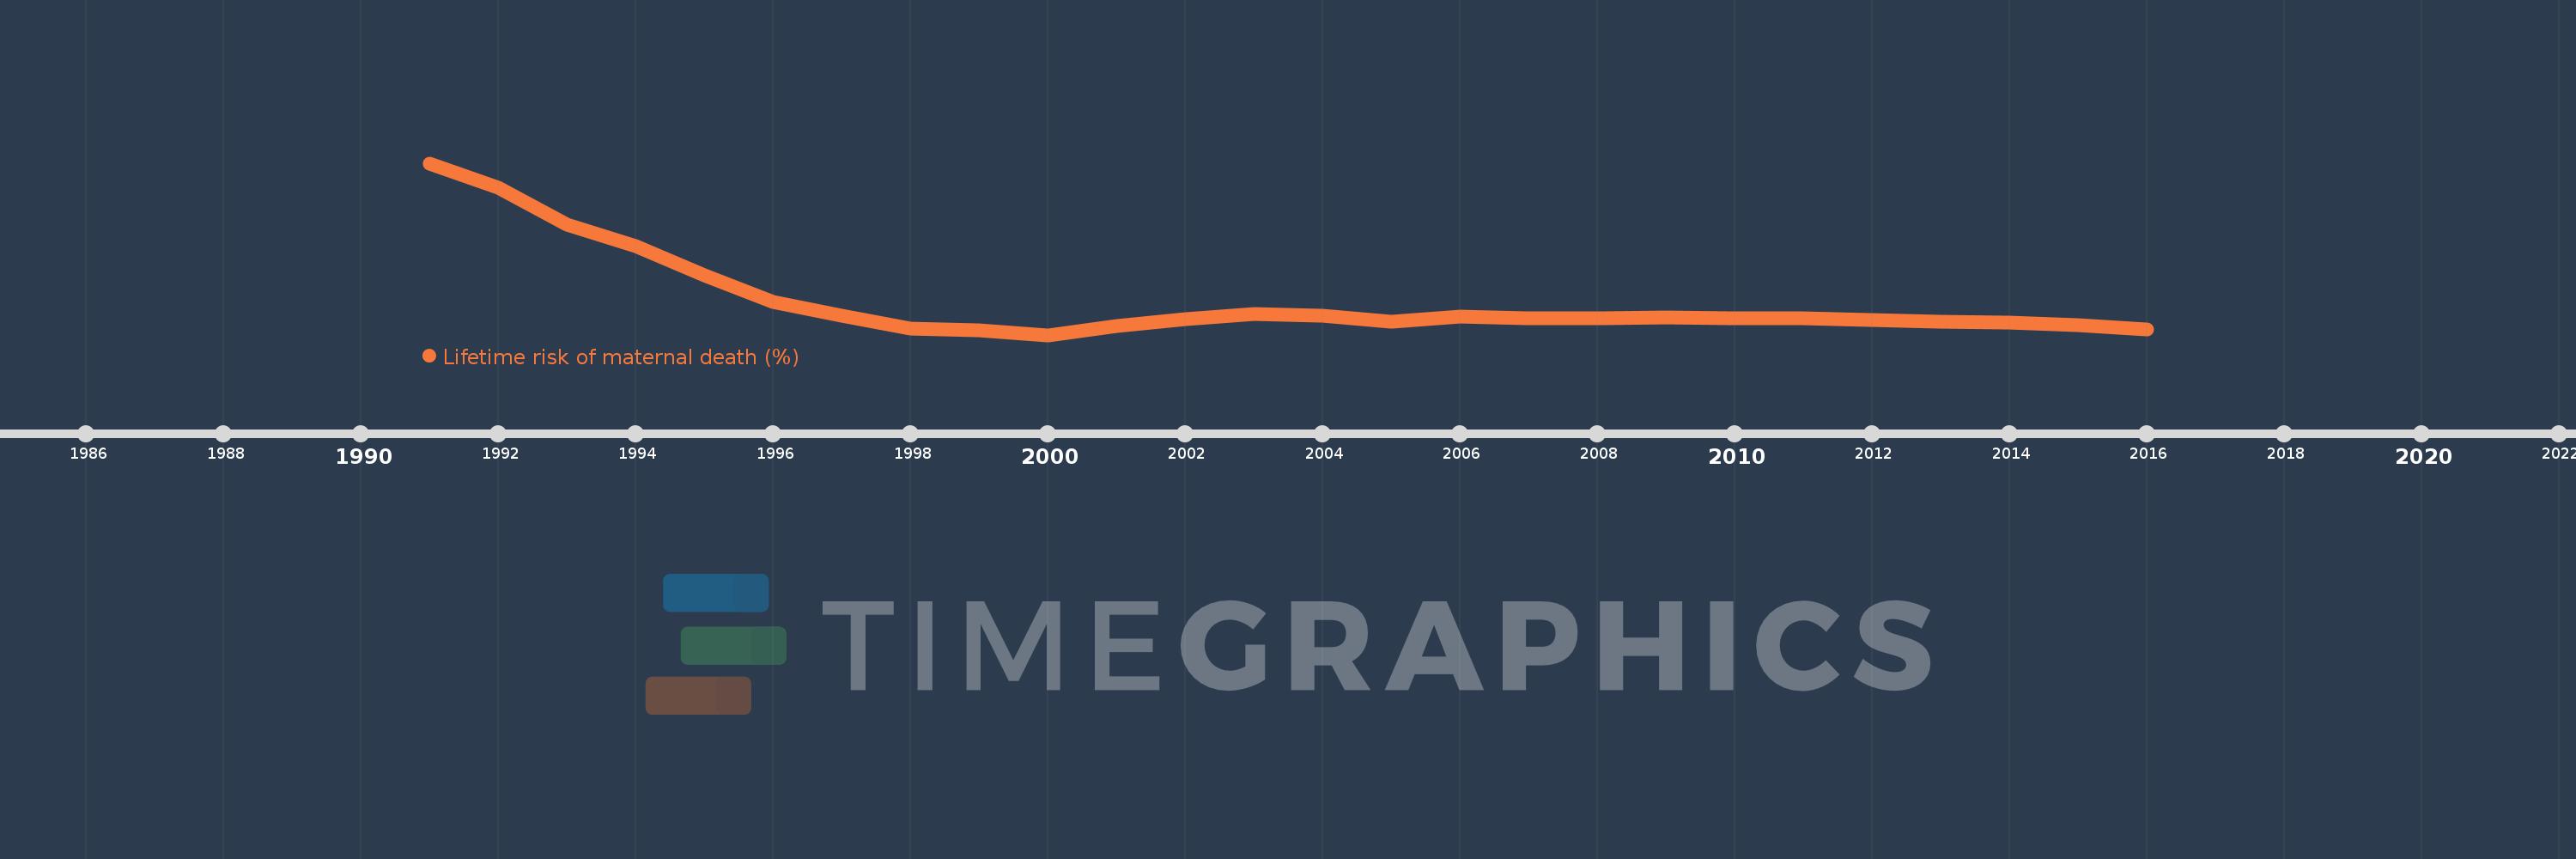
This timeline shows a graph from 1991 to 2016 of Uzbekistan. No data until 1990. Number of actual observations by date: 26.
Source name:
World Development Indicators
Source organization:
WHO, UNICEF, UNFPA, The World Bank, and the United Nations Population Division. Trends in Maternal Mortality: 1990 to 2015. Geneva, World Health Organization, 2015
Categories, topics:
Health, Gender
Last updated:
apr 23, 2017
Indicators value changes by year
Meaning:
0.128
Minimum:
0.093
jan 1, 2000
Maximum:
0.269
jan 1, 1991
At the date of observation
Value
Absolute change
Change from the previous value
jan 1, 1991
0.269
+0.269
0.0%
jan 1, 1992
0.244
-0.024
-9.12%
jan 1, 1993
0.206
-0.039
-15.8%
jan 1, 1994
0.184
-0.022
-10.69%
jan 1, 1995
0.154
-0.03
-16.29%
jan 1, 1996
0.127
-0.027
-17.64%
jan 1, 1997
0.113
-0.014
-10.81%
jan 1, 1998
0.1
-0.012
-11.02%
jan 1, 1999
0.098
-0.002
-1.95%
jan 1, 2000
0.093
-0.005
-5.45%
jan 1, 2001
0.102
+0.008
9.04%
jan 1, 2002
0.109
+0.008
7.42%
jan 1, 2003
0.115
+0.006
5.08%
jan 1, 2004
0.113
-0.002
-1.84%
jan 1, 2005
0.107
-0.006
-5.25%
jan 1, 2006
0.112
+0.006
5.34%
jan 1, 2007
0.11
-0.002
-1.69%
jan 1, 2008
0.11
+0.0
0.03%
jan 1, 2009
0.111
+0.0
0.23%
jan 1, 2010
0.11
-0.001
-0.46%
jan 1, 2011
0.11
-0.001
-0.5%
jan 1, 2012
0.108
-0.002
-1.48%
jan 1, 2013
0.107
-0.001
-0.97%
jan 1, 2014
0.106
-0.001
-1.21%
jan 1, 2015
0.103
-0.003
-2.59%
jan 1, 2016
0.099
-0.003
-3.35%
Ranking of countries by current statistics by years