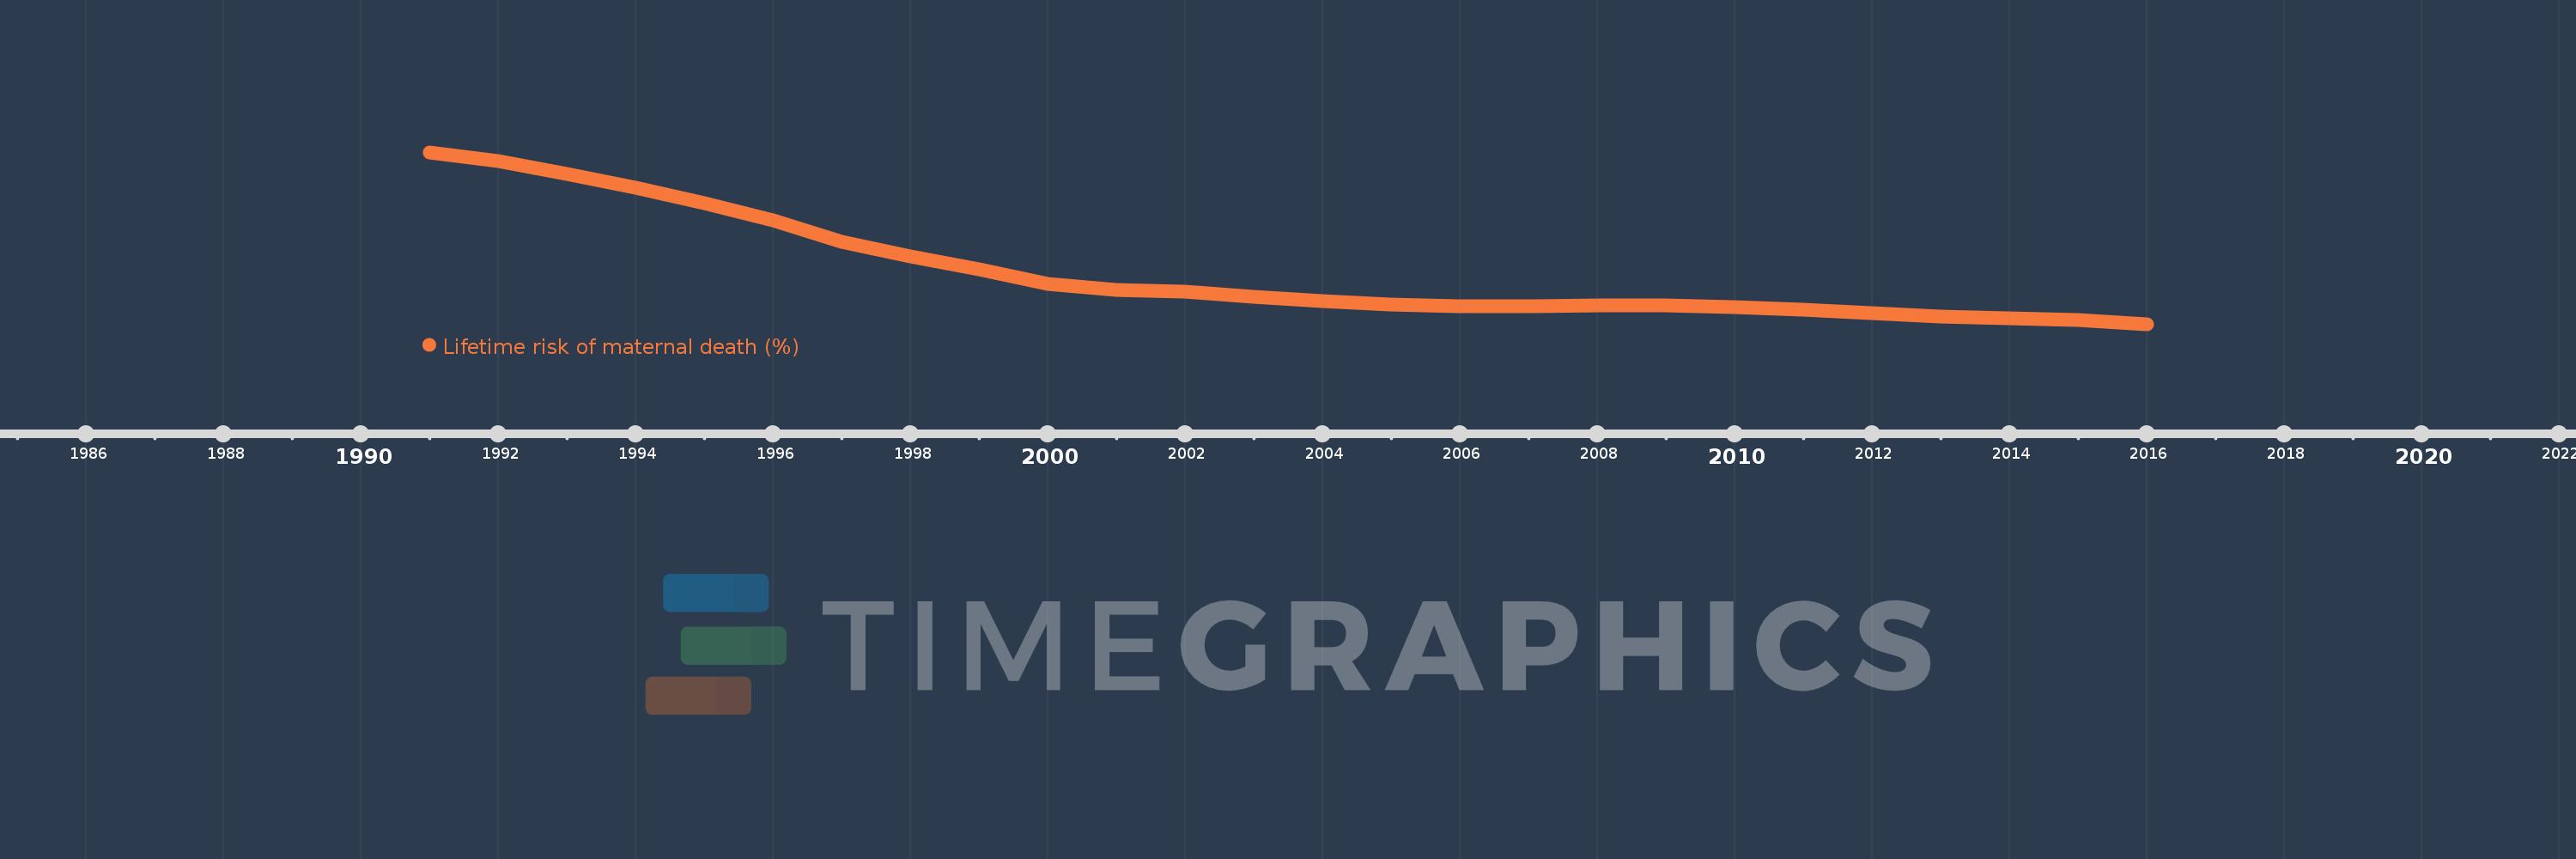
This timeline shows a graph from 1991 to 2016 of Eritrea. No data until 1990. Number of actual observations by date: 26.
Source name:
World Development Indicators
Source organization:
WHO, UNICEF, UNFPA, The World Bank, and the United Nations Population Division. Trends in Maternal Mortality: 1990 to 2015. Geneva, World Health Organization, 2015
Categories, topics:
Health, Gender
Last updated:
apr 23, 2017
Indicators value changes by year
Meaning:
4.342
Minimum:
2.33
jan 1, 2016
Maximum:
8.921
jan 1, 1991
At the date of observation
Value
Absolute change
Change from the previous value
jan 1, 1991
8.921
+8.921
0.0%
jan 1, 1992
8.572
-0.349
-3.91%
jan 1, 1993
8.104
-0.468
-5.45%
jan 1, 1994
7.574
-0.53
-6.54%
jan 1, 1995
6.957
-0.617
-8.15%
jan 1, 1996
6.322
-0.635
-9.13%
jan 1, 1997
5.493
-0.828
-13.1%
jan 1, 1998
4.939
-0.554
-10.09%
jan 1, 1999
4.444
-0.495
-10.02%
jan 1, 2000
3.888
-0.556
-12.52%
jan 1, 2001
3.643
-0.245
-6.3%
jan 1, 2002
3.576
-0.067
-1.84%
jan 1, 2003
3.368
-0.208
-5.82%
jan 1, 2004
3.214
-0.154
-4.57%
jan 1, 2005
3.086
-0.128
-3.97%
jan 1, 2006
3.023
-0.062
-2.02%
jan 1, 2007
3.03
+0.006
0.2%
jan 1, 2008
3.067
+0.038
1.25%
jan 1, 2009
3.056
-0.011
-0.36%
jan 1, 2010
2.983
-0.074
-2.41%
jan 1, 2011
2.872
-0.11
-3.7%
jan 1, 2012
2.755
-0.118
-4.09%
jan 1, 2013
2.623
-0.132
-4.79%
jan 1, 2014
2.561
-0.062
-2.37%
jan 1, 2015
2.482
-0.078
-3.05%
jan 1, 2016
2.33
-0.153
-6.16%
Ranking of countries by current statistics by years