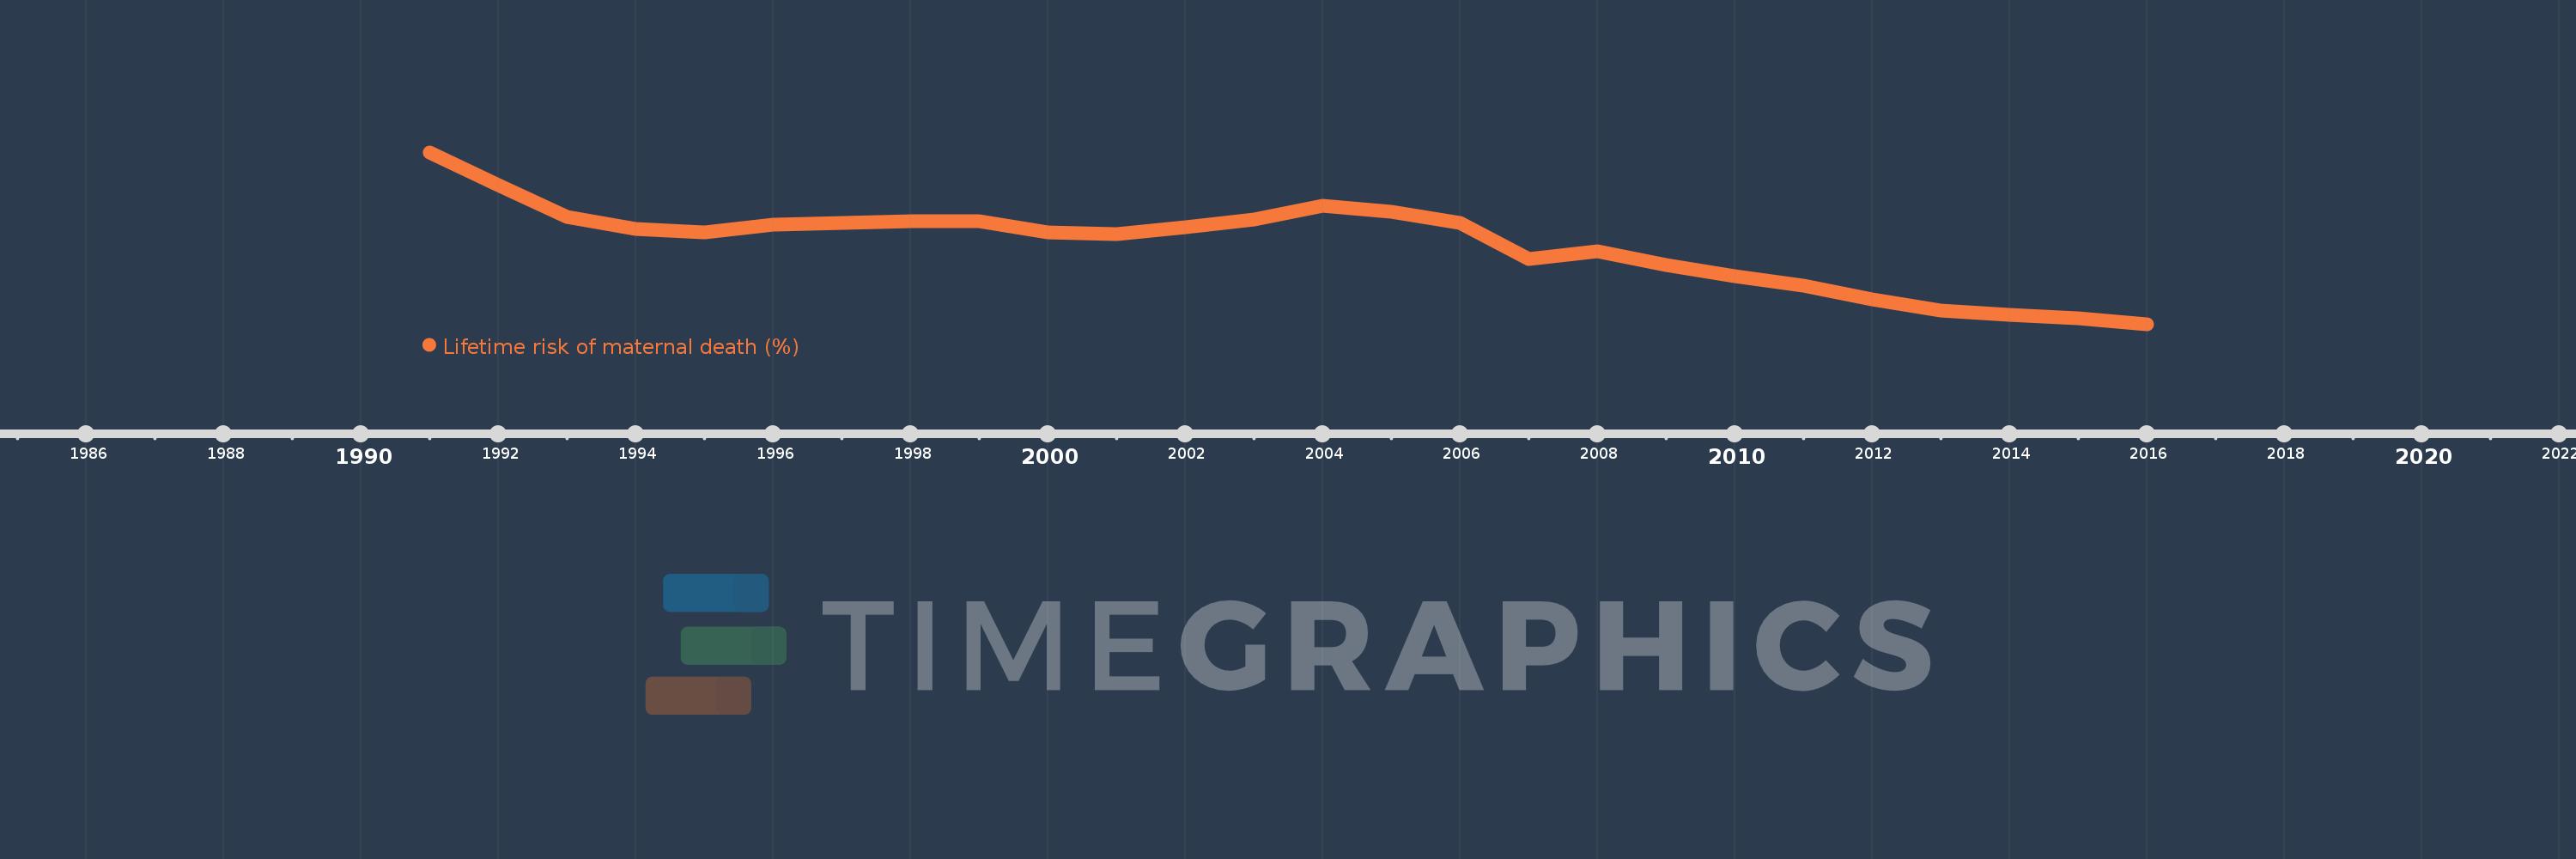
This timeline shows a graph from 1991 to 2016 of St. Lucia. No data until 1990. Number of actual observations by date: 26.
Source name:
World Development Indicators
Source organization:
WHO, UNICEF, UNFPA, The World Bank, and the United Nations Population Division. Trends in Maternal Mortality: 1990 to 2015. Geneva, World Health Organization, 2015
Categories, topics:
Health, Gender
Last updated:
apr 23, 2017
Indicators value changes by year
Meaning:
0.133
Minimum:
0.091
jan 1, 2016
Maximum:
0.181
jan 1, 1991
At the date of observation
Value
Absolute change
Change from the previous value
jan 1, 1991
0.181
+0.181
0.0%
jan 1, 1992
0.164
-0.017
-9.44%
jan 1, 1993
0.147
-0.016
-10.06%
jan 1, 1994
0.141
-0.006
-3.81%
jan 1, 1995
0.139
-0.002
-1.75%
jan 1, 1996
0.143
+0.004
2.65%
jan 1, 1997
0.144
+0.001
0.7%
jan 1, 1998
0.145
+0.001
1.01%
jan 1, 1999
0.145
+0.0
0.22%
jan 1, 2000
0.139
-0.007
-4.52%
jan 1, 2001
0.138
-0.001
-0.51%
jan 1, 2002
0.142
+0.004
2.92%
jan 1, 2003
0.146
+0.004
2.65%
jan 1, 2004
0.153
+0.007
4.94%
jan 1, 2005
0.15
-0.003
-2.1%
jan 1, 2006
0.144
-0.006
-4.32%
jan 1, 2007
0.125
-0.018
-12.74%
jan 1, 2008
0.129
+0.004
3.32%
jan 1, 2009
0.122
-0.008
-5.93%
jan 1, 2010
0.116
-0.006
-4.64%
jan 1, 2011
0.111
-0.005
-4.47%
jan 1, 2012
0.104
-0.007
-6.53%
jan 1, 2013
0.098
-0.005
-5.28%
jan 1, 2014
0.096
-0.002
-2.53%
jan 1, 2015
0.094
-0.002
-2.05%
jan 1, 2016
0.091
-0.003
-2.71%
Ranking of countries by current statistics by years