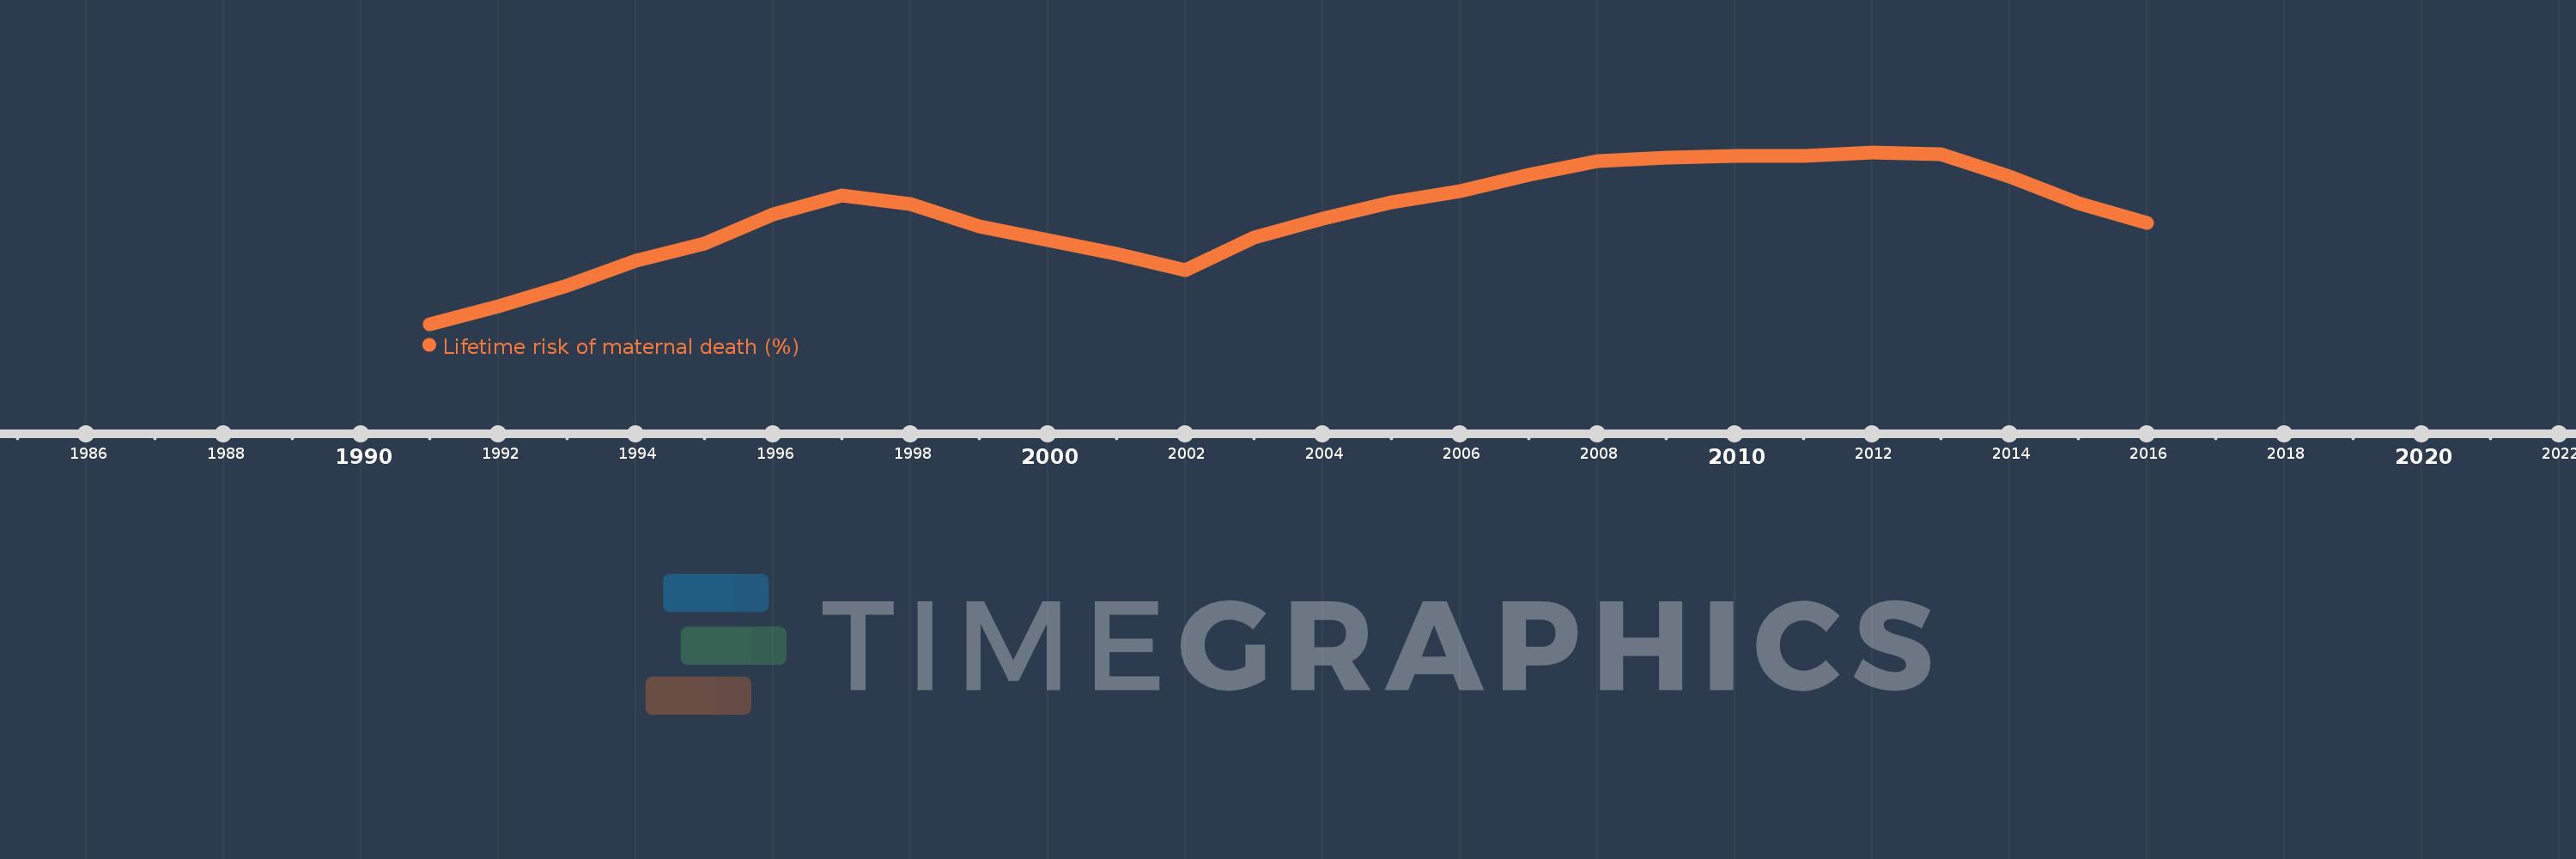
This timeline shows a graph from 1991 to 2016 of Tonga. No data until 1990. Number of actual observations by date: 26.
Source name:
World Development Indicators
Source organization:
WHO, UNICEF, UNFPA, The World Bank, and the United Nations Population Division. Trends in Maternal Mortality: 1990 to 2015. Geneva, World Health Organization, 2015
Categories, topics:
Health, Gender
Last updated:
apr 23, 2017
Indicators value changes by year
Meaning:
0.441
Minimum:
0.342
jan 1, 1991
Maximum:
0.498
jan 1, 2012
At the date of observation
Value
Absolute change
Change from the previous value
jan 1, 1991
0.342
+0.342
0.0%
jan 1, 1992
0.358
+0.016
4.67%
jan 1, 1993
0.377
+0.019
5.2%
jan 1, 1994
0.4
+0.023
5.99%
jan 1, 1995
0.415
+0.016
3.95%
jan 1, 1996
0.442
+0.027
6.44%
jan 1, 1997
0.459
+0.017
3.87%
jan 1, 1998
0.451
-0.008
-1.79%
jan 1, 1999
0.431
-0.02
-4.44%
jan 1, 2000
0.418
-0.013
-2.99%
jan 1, 2001
0.406
-0.012
-2.91%
jan 1, 2002
0.391
-0.015
-3.69%
jan 1, 2003
0.421
+0.03
7.63%
jan 1, 2004
0.438
+0.017
3.98%
jan 1, 2005
0.453
+0.015
3.43%
jan 1, 2006
0.463
+0.01
2.31%
jan 1, 2007
0.478
+0.015
3.28%
jan 1, 2008
0.49
+0.011
2.37%
jan 1, 2009
0.493
+0.003
0.63%
jan 1, 2010
0.495
+0.002
0.46%
jan 1, 2011
0.495
+0.0
0.05%
jan 1, 2012
0.498
+0.003
0.51%
jan 1, 2013
0.496
-0.002
-0.32%
jan 1, 2014
0.476
-0.021
-4.13%
jan 1, 2015
0.452
-0.023
-4.91%
jan 1, 2016
0.434
-0.019
-4.09%
Ranking of countries by current statistics by years