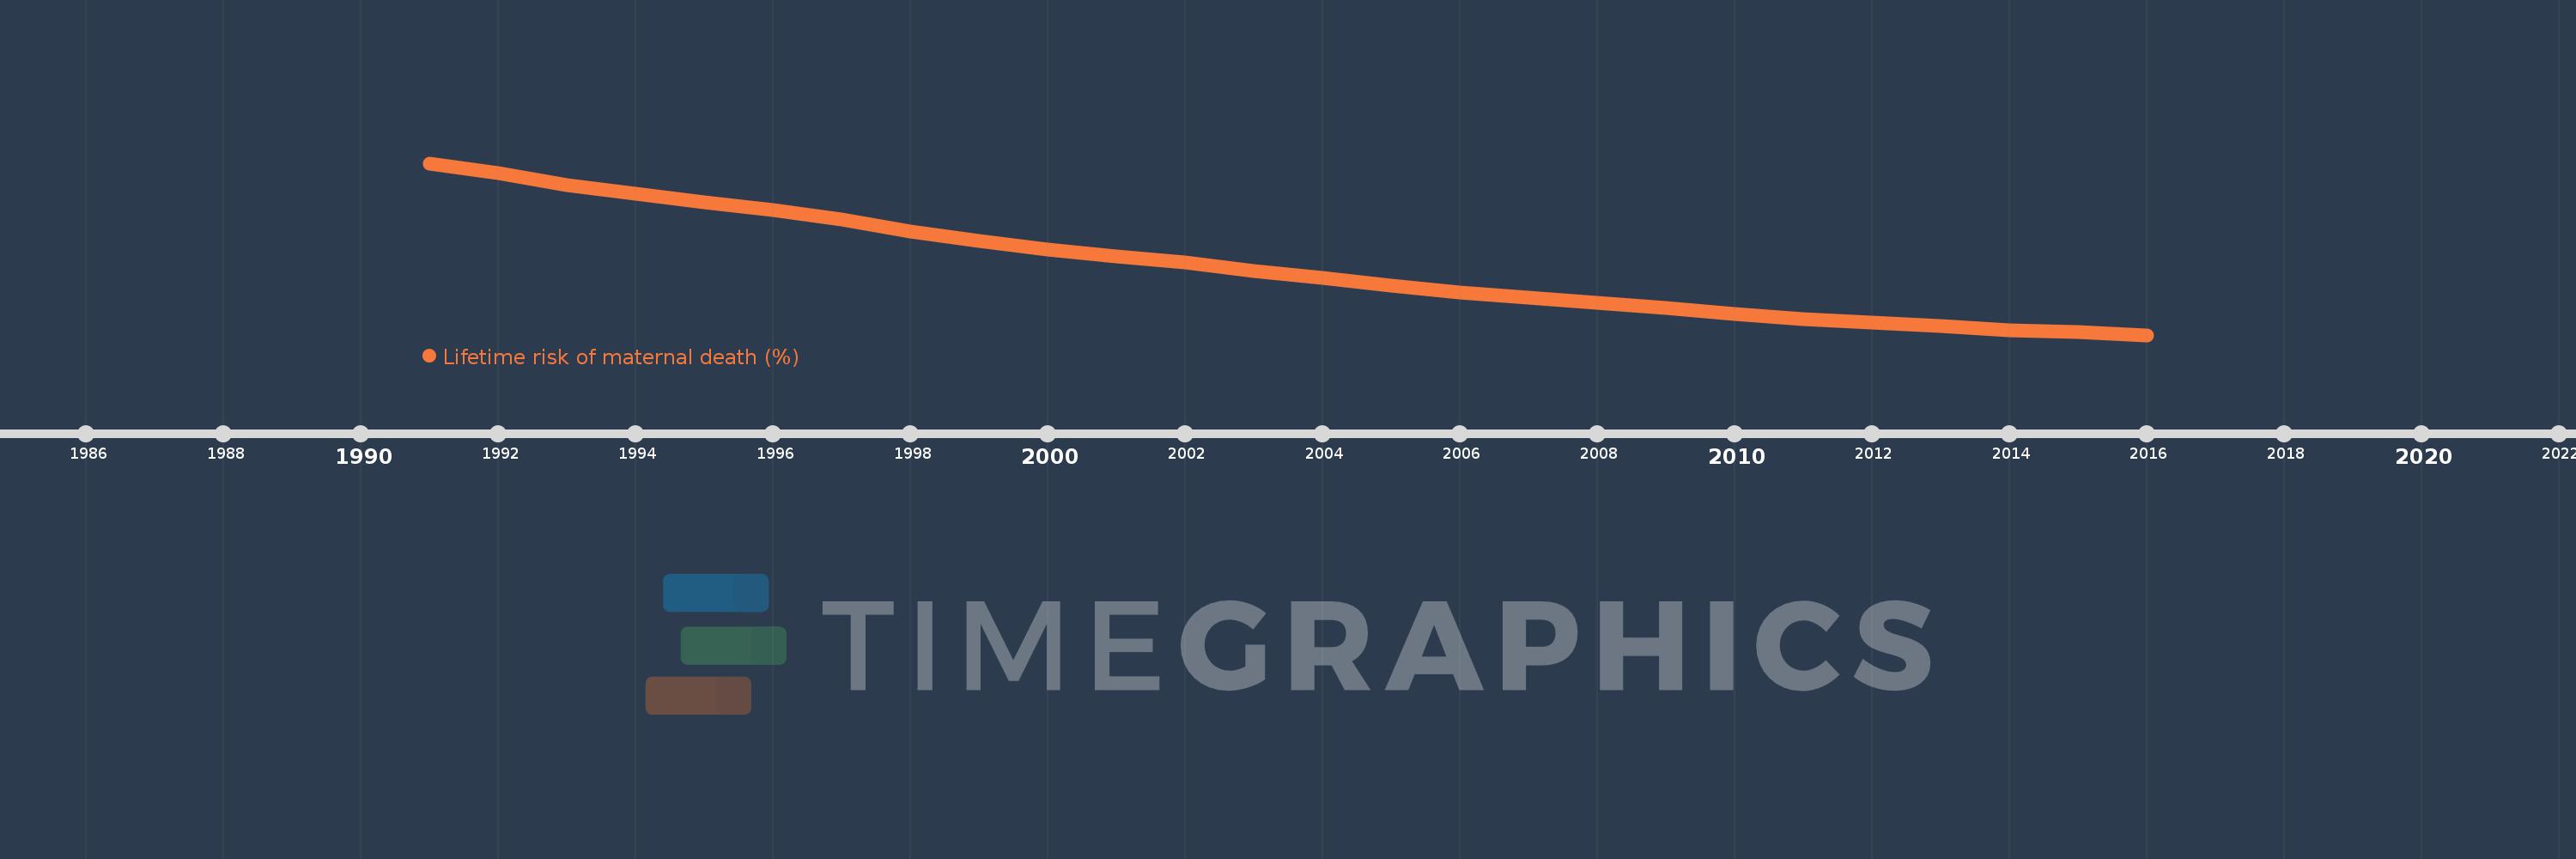
This timeline shows a graph from 1991 to 2016 of Djibouti. No data until 1990. Number of actual observations by date: 26.
Source name:
World Development Indicators
Source organization:
WHO, UNICEF, UNFPA, The World Bank, and the United Nations Population Division. Trends in Maternal Mortality: 1990 to 2015. Geneva, World Health Organization, 2015
Categories, topics:
Health, Gender
Last updated:
apr 23, 2017
Indicators value changes by year
Meaning:
1.575
Minimum:
0.698
jan 1, 2016
Maximum:
2.864
jan 1, 1991
At the date of observation
Value
Absolute change
Change from the previous value
jan 1, 1991
2.864
+2.864
0.0%
jan 1, 1992
2.74
-0.124
-4.34%
jan 1, 1993
2.585
-0.155
-5.67%
jan 1, 1994
2.481
-0.103
-4.0%
jan 1, 1995
2.374
-0.108
-4.33%
jan 1, 1996
2.271
-0.103
-4.33%
jan 1, 1997
2.15
-0.121
-5.33%
jan 1, 1998
2.002
-0.149
-6.91%
jan 1, 1999
1.888
-0.113
-5.67%
jan 1, 2000
1.78
-0.108
-5.74%
jan 1, 2001
1.685
-0.095
-5.34%
jan 1, 2002
1.613
-0.072
-4.25%
jan 1, 2003
1.509
-0.104
-6.46%
jan 1, 2004
1.42
-0.089
-5.89%
jan 1, 2005
1.325
-0.095
-6.71%
jan 1, 2006
1.232
-0.093
-7.01%
jan 1, 2007
1.164
-0.068
-5.5%
jan 1, 2008
1.107
-0.057
-4.91%
jan 1, 2009
1.044
-0.063
-5.71%
jan 1, 2010
0.962
-0.082
-7.87%
jan 1, 2011
0.895
-0.067
-6.98%
jan 1, 2012
0.852
-0.043
-4.78%
jan 1, 2013
0.813
-0.039
-4.56%
jan 1, 2014
0.761
-0.052
-6.35%
jan 1, 2015
0.732
-0.029
-3.78%
jan 1, 2016
0.698
-0.034
-4.7%
Ranking of countries by current statistics by years