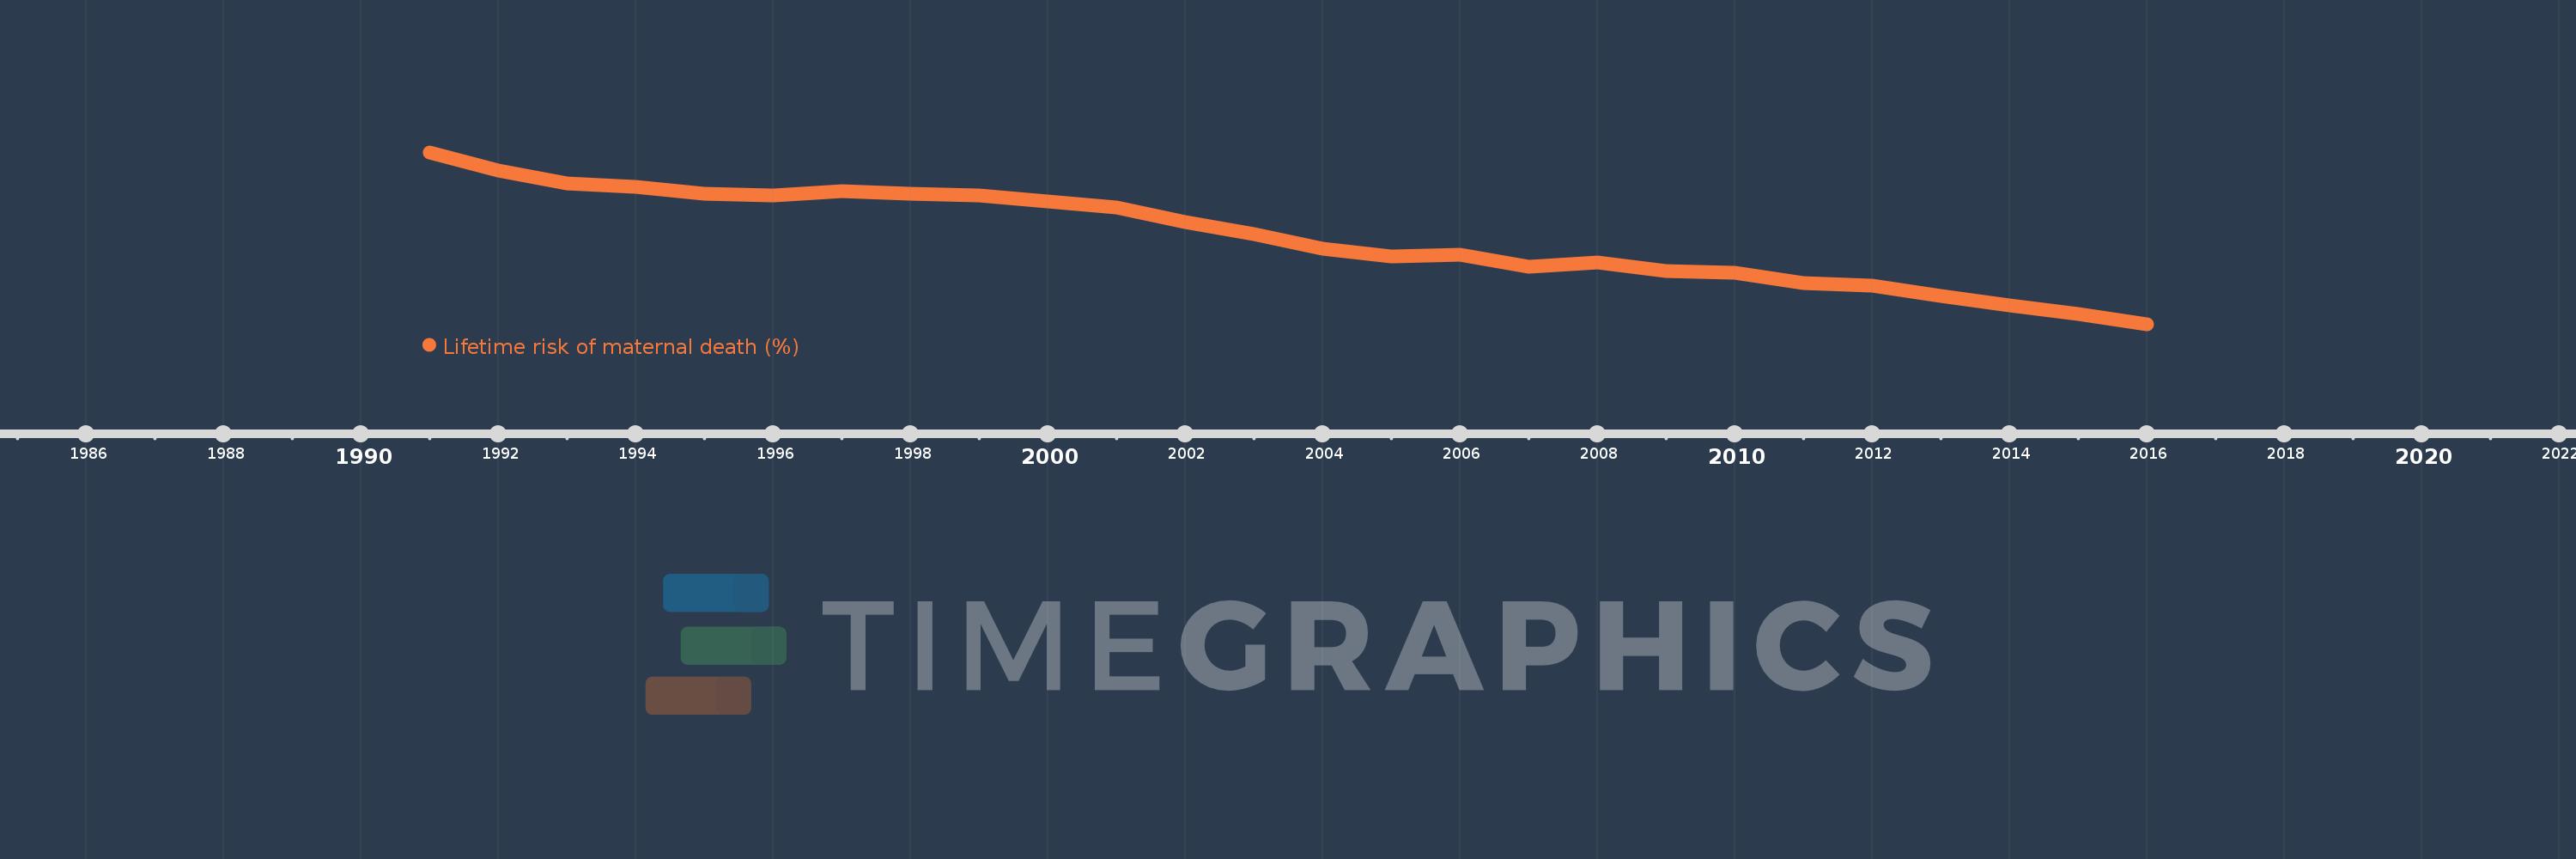
This timeline shows a graph from 1991 to 2016 of Jamaica. No data until 1990. Number of actual observations by date: 26.
Source name:
World Development Indicators
Source organization:
WHO, UNICEF, UNFPA, The World Bank, and the United Nations Population Division. Trends in Maternal Mortality: 1990 to 2015. Geneva, World Health Organization, 2015
Categories, topics:
Health, Gender
Last updated:
apr 23, 2017
Indicators value changes by year
Meaning:
0.237
Minimum:
0.194
jan 1, 2016
Maximum:
0.278
jan 1, 1991
At the date of observation
Value
Absolute change
Change from the previous value
jan 1, 1991
0.278
+0.278
0.0%
jan 1, 1992
0.269
-0.009
-3.31%
jan 1, 1993
0.263
-0.007
-2.43%
jan 1, 1994
0.261
-0.002
-0.68%
jan 1, 1995
0.258
-0.003
-1.04%
jan 1, 1996
0.257
-0.001
-0.52%
jan 1, 1997
0.259
+0.002
0.77%
jan 1, 1998
0.258
-0.001
-0.21%
jan 1, 1999
0.257
-0.001
-0.35%
jan 1, 2000
0.254
-0.003
-1.21%
jan 1, 2001
0.251
-0.003
-1.2%
jan 1, 2002
0.244
-0.007
-2.84%
jan 1, 2003
0.238
-0.006
-2.57%
jan 1, 2004
0.231
-0.006
-2.67%
jan 1, 2005
0.227
-0.004
-1.67%
jan 1, 2006
0.228
+0.0
0.17%
jan 1, 2007
0.222
-0.006
-2.7%
jan 1, 2008
0.224
+0.002
0.88%
jan 1, 2009
0.22
-0.003
-1.46%
jan 1, 2010
0.219
-0.001
-0.5%
jan 1, 2011
0.214
-0.005
-2.19%
jan 1, 2012
0.213
-0.001
-0.63%
jan 1, 2013
0.208
-0.005
-2.38%
jan 1, 2014
0.203
-0.005
-2.37%
jan 1, 2015
0.199
-0.004
-2.0%
jan 1, 2016
0.194
-0.005
-2.69%
Ranking of countries by current statistics by years