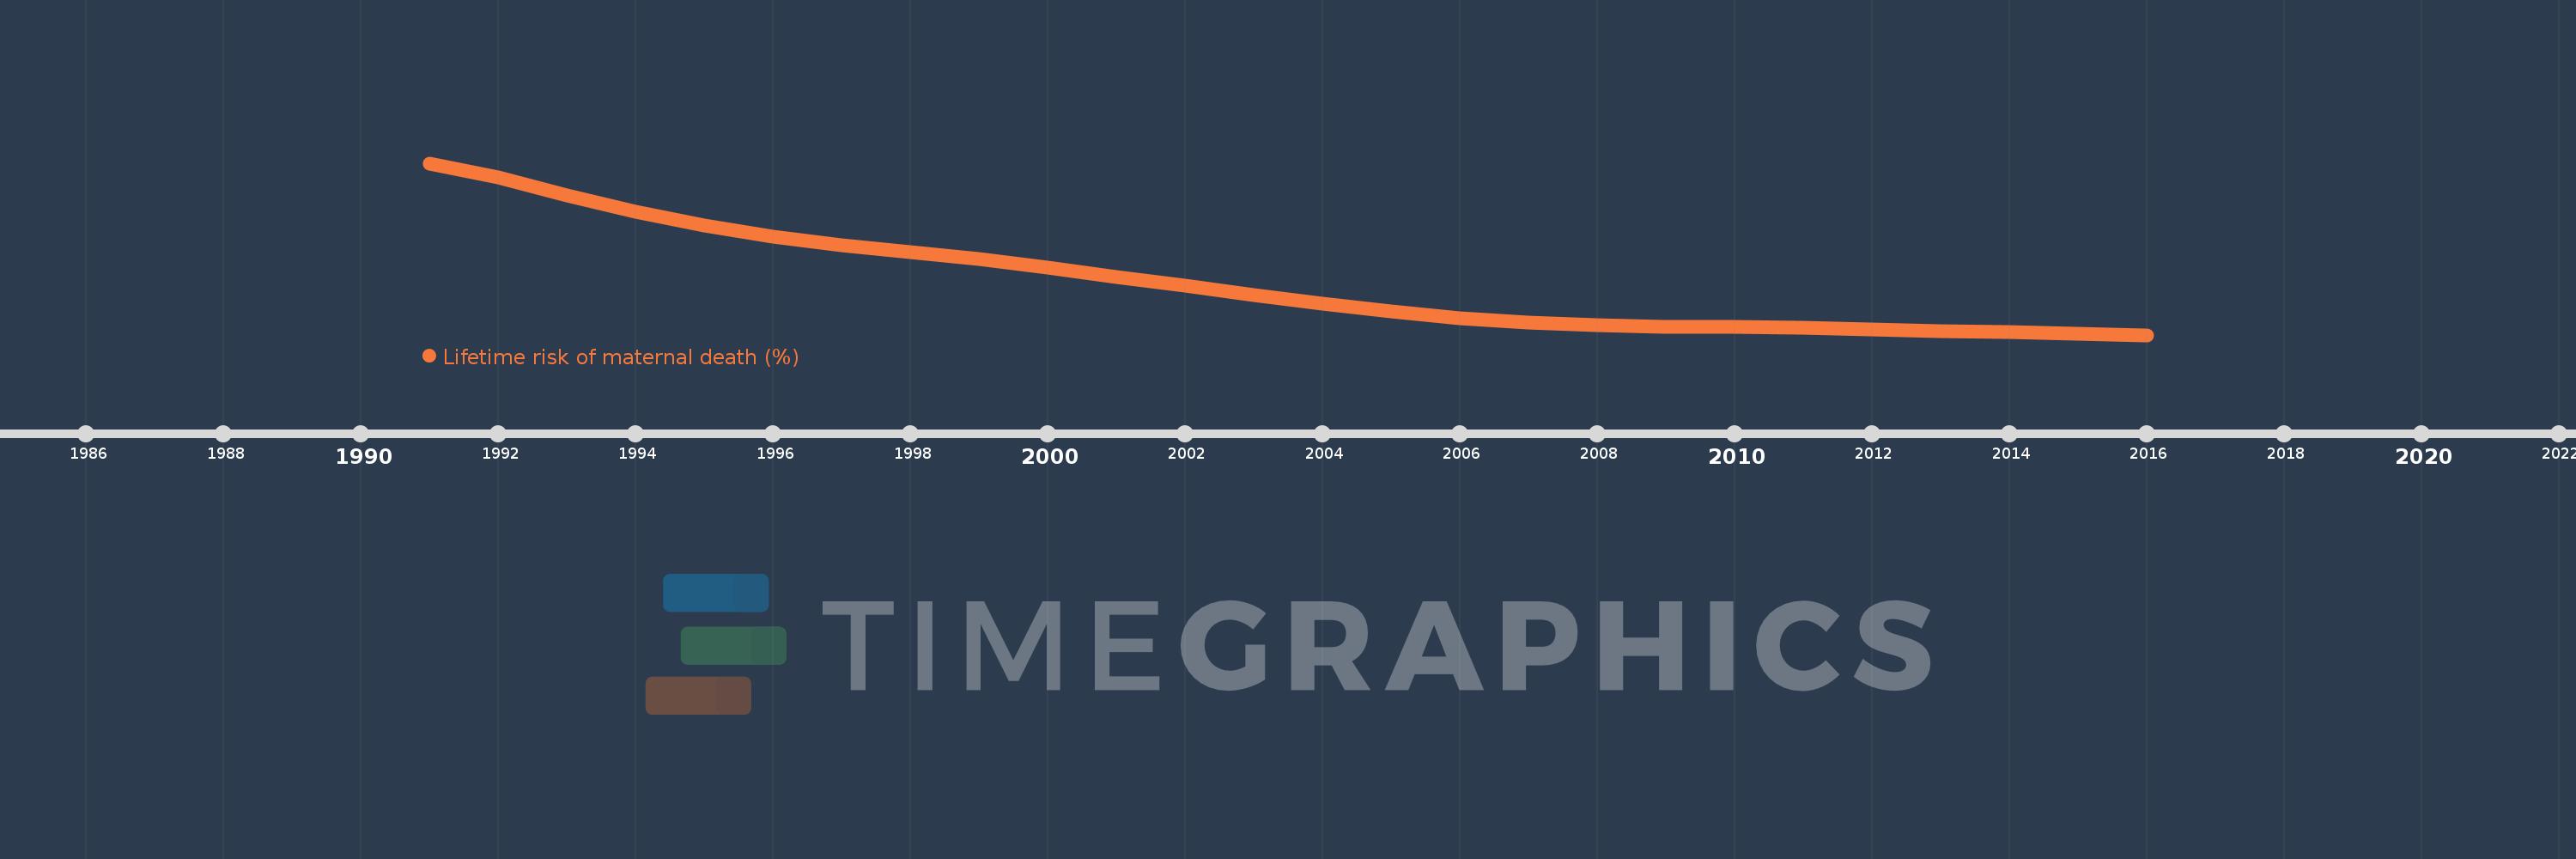
This timeline shows a graph from 1991 to 2016 of Lebanon. No data until 1990. Number of actual observations by date: 26.
Source name:
World Development Indicators
Source organization:
WHO, UNICEF, UNFPA, The World Bank, and the United Nations Population Division. Trends in Maternal Mortality: 1990 to 2015. Geneva, World Health Organization, 2015
Categories, topics:
Health, Gender
Last updated:
apr 23, 2017
Indicators value changes by year
Meaning:
0.096
Minimum:
0.027
jan 1, 2016
Maximum:
0.249
jan 1, 1991
At the date of observation
Value
Absolute change
Change from the previous value
jan 1, 1991
0.249
+0.249
0.0%
jan 1, 1992
0.231
-0.017
-6.96%
jan 1, 1993
0.207
-0.024
-10.58%
jan 1, 1994
0.186
-0.021
-10.03%
jan 1, 1995
0.169
-0.017
-9.4%
jan 1, 1996
0.154
-0.015
-8.75%
jan 1, 1997
0.143
-0.011
-7.04%
jan 1, 1998
0.134
-0.009
-6.43%
jan 1, 1999
0.125
-0.009
-6.69%
jan 1, 2000
0.114
-0.011
-8.56%
jan 1, 2001
0.102
-0.013
-11.0%
jan 1, 2002
0.091
-0.01
-10.3%
jan 1, 2003
0.079
-0.012
-12.85%
jan 1, 2004
0.068
-0.012
-14.49%
jan 1, 2005
0.057
-0.011
-15.47%
jan 1, 2006
0.049
-0.008
-14.52%
jan 1, 2007
0.043
-0.006
-12.39%
jan 1, 2008
0.04
-0.003
-7.21%
jan 1, 2009
0.038
-0.002
-4.47%
jan 1, 2010
0.037
-0.001
-3.02%
jan 1, 2011
0.036
-0.001
-2.42%
jan 1, 2012
0.034
-0.002
-4.87%
jan 1, 2013
0.032
-0.002
-5.49%
jan 1, 2014
0.031
-0.002
-5.85%
jan 1, 2015
0.029
-0.002
-5.61%
jan 1, 2016
0.027
-0.002
-5.4%
Ranking of countries by current statistics by years