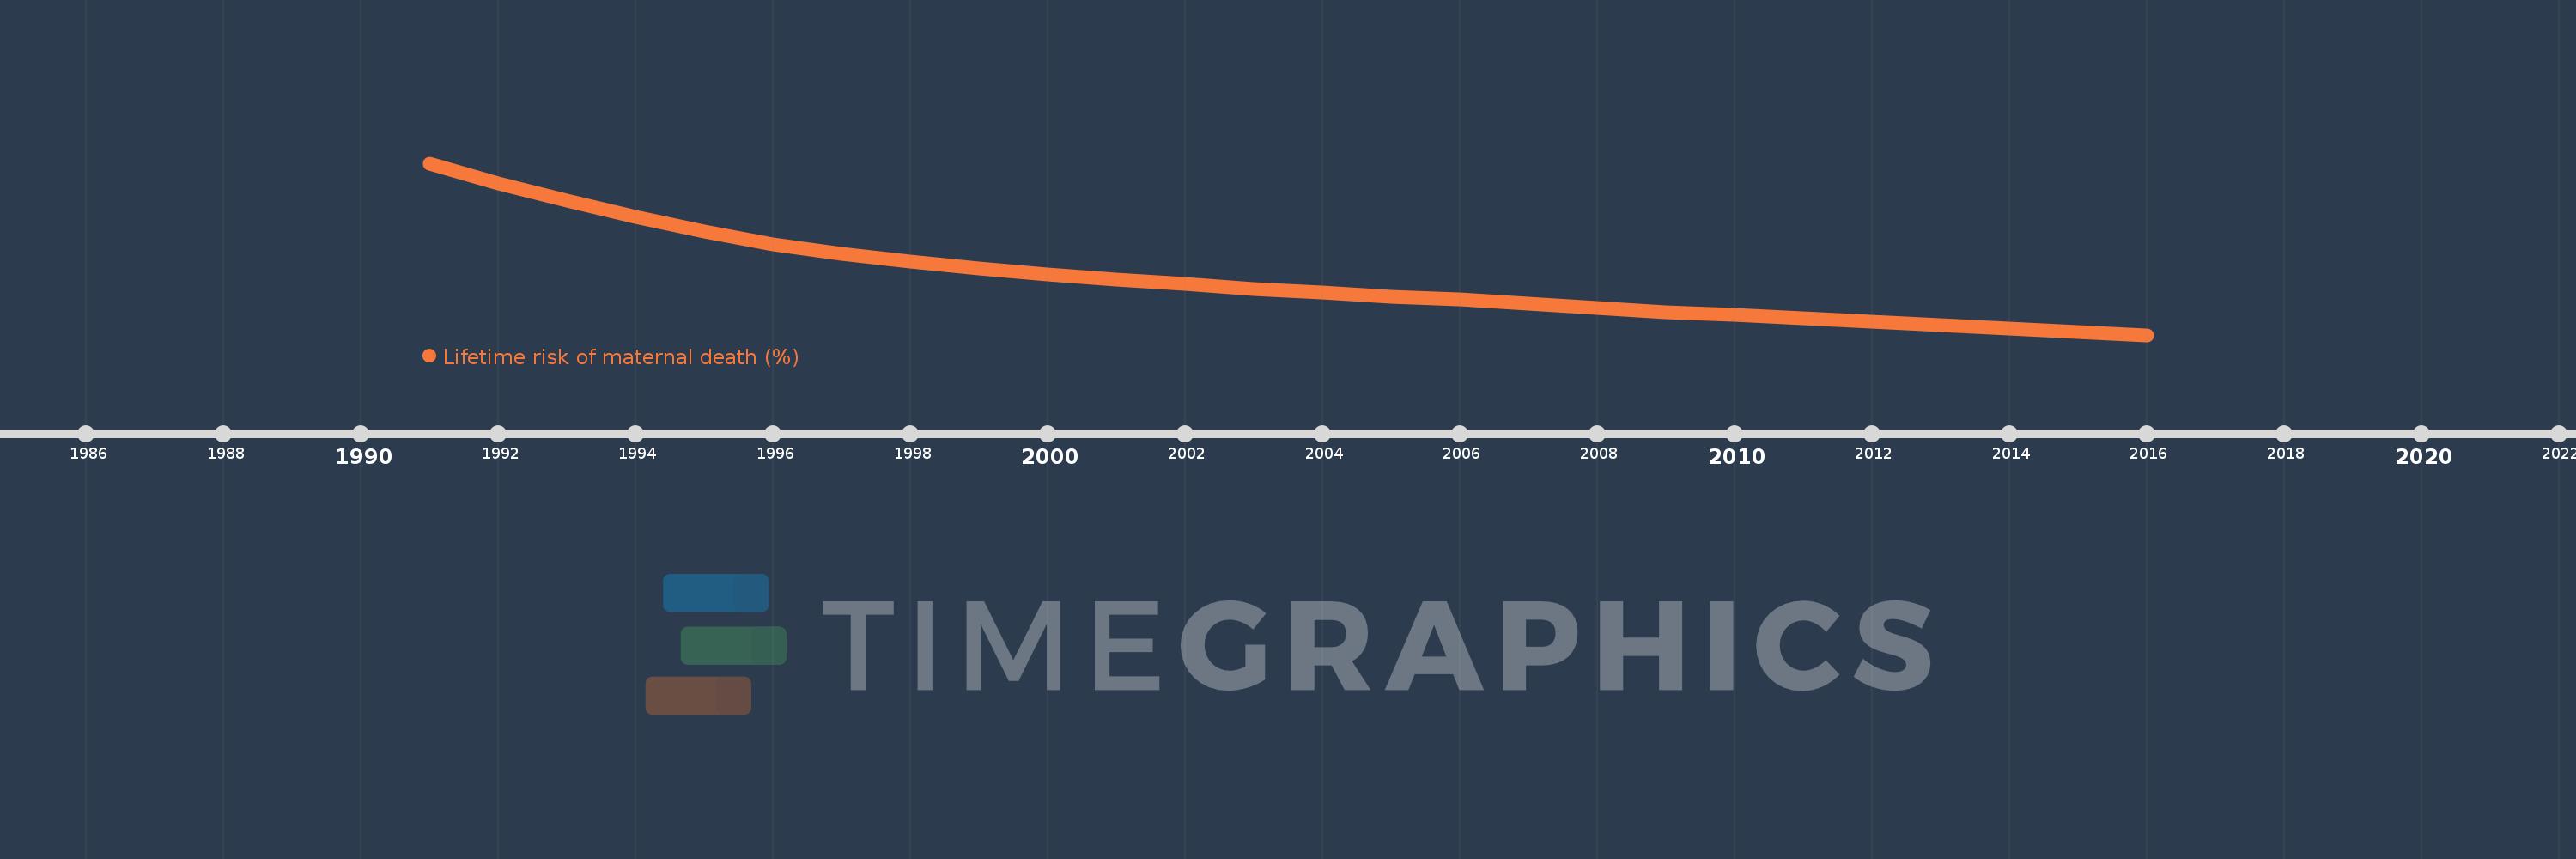
This timeline shows a graph from 1991 to 2016 of Indonesia. No data until 1990. Number of actual observations by date: 26.
Source name:
World Development Indicators
Source organization:
WHO, UNICEF, UNFPA, The World Bank, and the United Nations Population Division. Trends in Maternal Mortality: 1990 to 2015. Geneva, World Health Organization, 2015
Categories, topics:
Health, Gender
Last updated:
apr 23, 2017
Indicators value changes by year
Meaning:
0.714
Minimum:
0.314
jan 1, 2016
Maximum:
1.529
jan 1, 1991
At the date of observation
Value
Absolute change
Change from the previous value
jan 1, 1991
1.529
+1.529
0.0%
jan 1, 1992
1.388
-0.141
-9.24%
jan 1, 1993
1.262
-0.126
-9.09%
jan 1, 1994
1.149
-0.113
-8.95%
jan 1, 1995
1.049
-0.099
-8.66%
jan 1, 1996
0.955
-0.094
-8.94%
jan 1, 1997
0.889
-0.066
-6.9%
jan 1, 1998
0.833
-0.057
-6.39%
jan 1, 1999
0.783
-0.049
-5.94%
jan 1, 2000
0.743
-0.041
-5.18%
jan 1, 2001
0.706
-0.036
-4.91%
jan 1, 2002
0.673
-0.033
-4.64%
jan 1, 2003
0.641
-0.032
-4.77%
jan 1, 2004
0.614
-0.027
-4.23%
jan 1, 2005
0.583
-0.032
-5.15%
jan 1, 2006
0.566
-0.016
-2.8%
jan 1, 2007
0.533
-0.034
-5.94%
jan 1, 2008
0.504
-0.029
-5.41%
jan 1, 2009
0.478
-0.025
-5.04%
jan 1, 2010
0.456
-0.022
-4.65%
jan 1, 2011
0.434
-0.023
-4.95%
jan 1, 2012
0.408
-0.026
-5.95%
jan 1, 2013
0.384
-0.024
-5.92%
jan 1, 2014
0.36
-0.024
-6.19%
jan 1, 2015
0.337
-0.023
-6.49%
jan 1, 2016
0.314
-0.022
-6.64%
Ranking of countries by current statistics by years