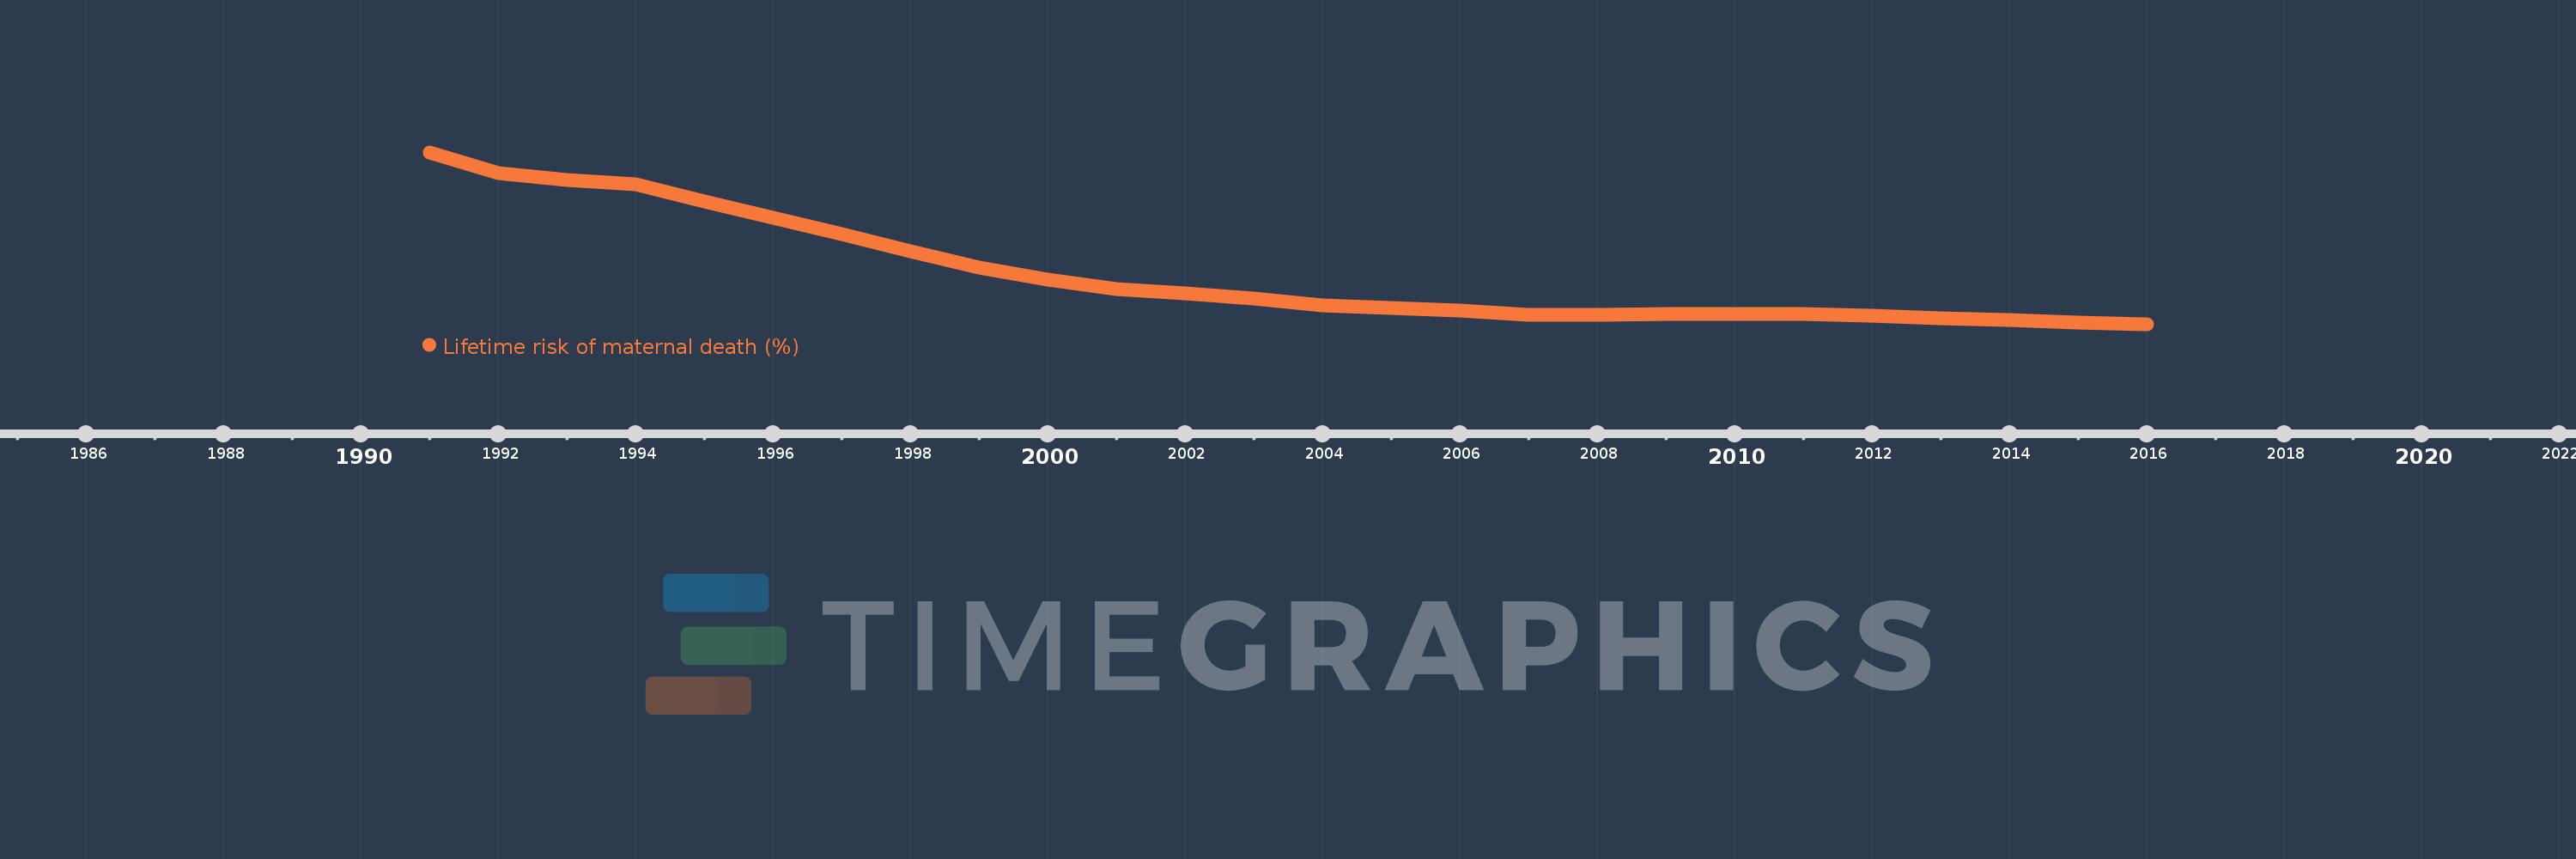
This timeline shows a graph from 1991 to 2016 of Iraq. No data until 1990. Number of actual observations by date: 26.
Source name:
World Development Indicators
Source organization:
WHO, UNICEF, UNFPA, The World Bank, and the United Nations Population Division. Trends in Maternal Mortality: 1990 to 2015. Geneva, World Health Organization, 2015
Categories, topics:
Health, Gender
Last updated:
apr 23, 2017
Indicators value changes by year
Meaning:
0.356
Minimum:
0.241
jan 1, 2016
Maximum:
0.634
jan 1, 1991
At the date of observation
Value
Absolute change
Change from the previous value
jan 1, 1991
0.634
+0.634
0.0%
jan 1, 1992
0.587
-0.047
-7.36%
jan 1, 1993
0.571
-0.017
-2.85%
jan 1, 1994
0.561
-0.009
-1.62%
jan 1, 1995
0.521
-0.04
-7.14%
jan 1, 1996
0.485
-0.037
-7.0%
jan 1, 1997
0.447
-0.038
-7.79%
jan 1, 1998
0.407
-0.04
-8.96%
jan 1, 1999
0.371
-0.036
-8.78%
jan 1, 2000
0.343
-0.028
-7.49%
jan 1, 2001
0.322
-0.021
-6.18%
jan 1, 2002
0.311
-0.011
-3.56%
jan 1, 2003
0.299
-0.011
-3.67%
jan 1, 2004
0.284
-0.015
-4.97%
jan 1, 2005
0.278
-0.007
-2.33%
jan 1, 2006
0.272
-0.006
-2.1%
jan 1, 2007
0.263
-0.009
-3.27%
jan 1, 2008
0.262
-0.001
-0.42%
jan 1, 2009
0.264
+0.002
0.92%
jan 1, 2010
0.265
+0.001
0.32%
jan 1, 2011
0.264
-0.002
-0.63%
jan 1, 2012
0.26
-0.003
-1.31%
jan 1, 2013
0.255
-0.005
-1.99%
jan 1, 2014
0.25
-0.005
-2.03%
jan 1, 2015
0.245
-0.005
-1.84%
jan 1, 2016
0.241
-0.005
-1.85%
Ranking of countries by current statistics by years