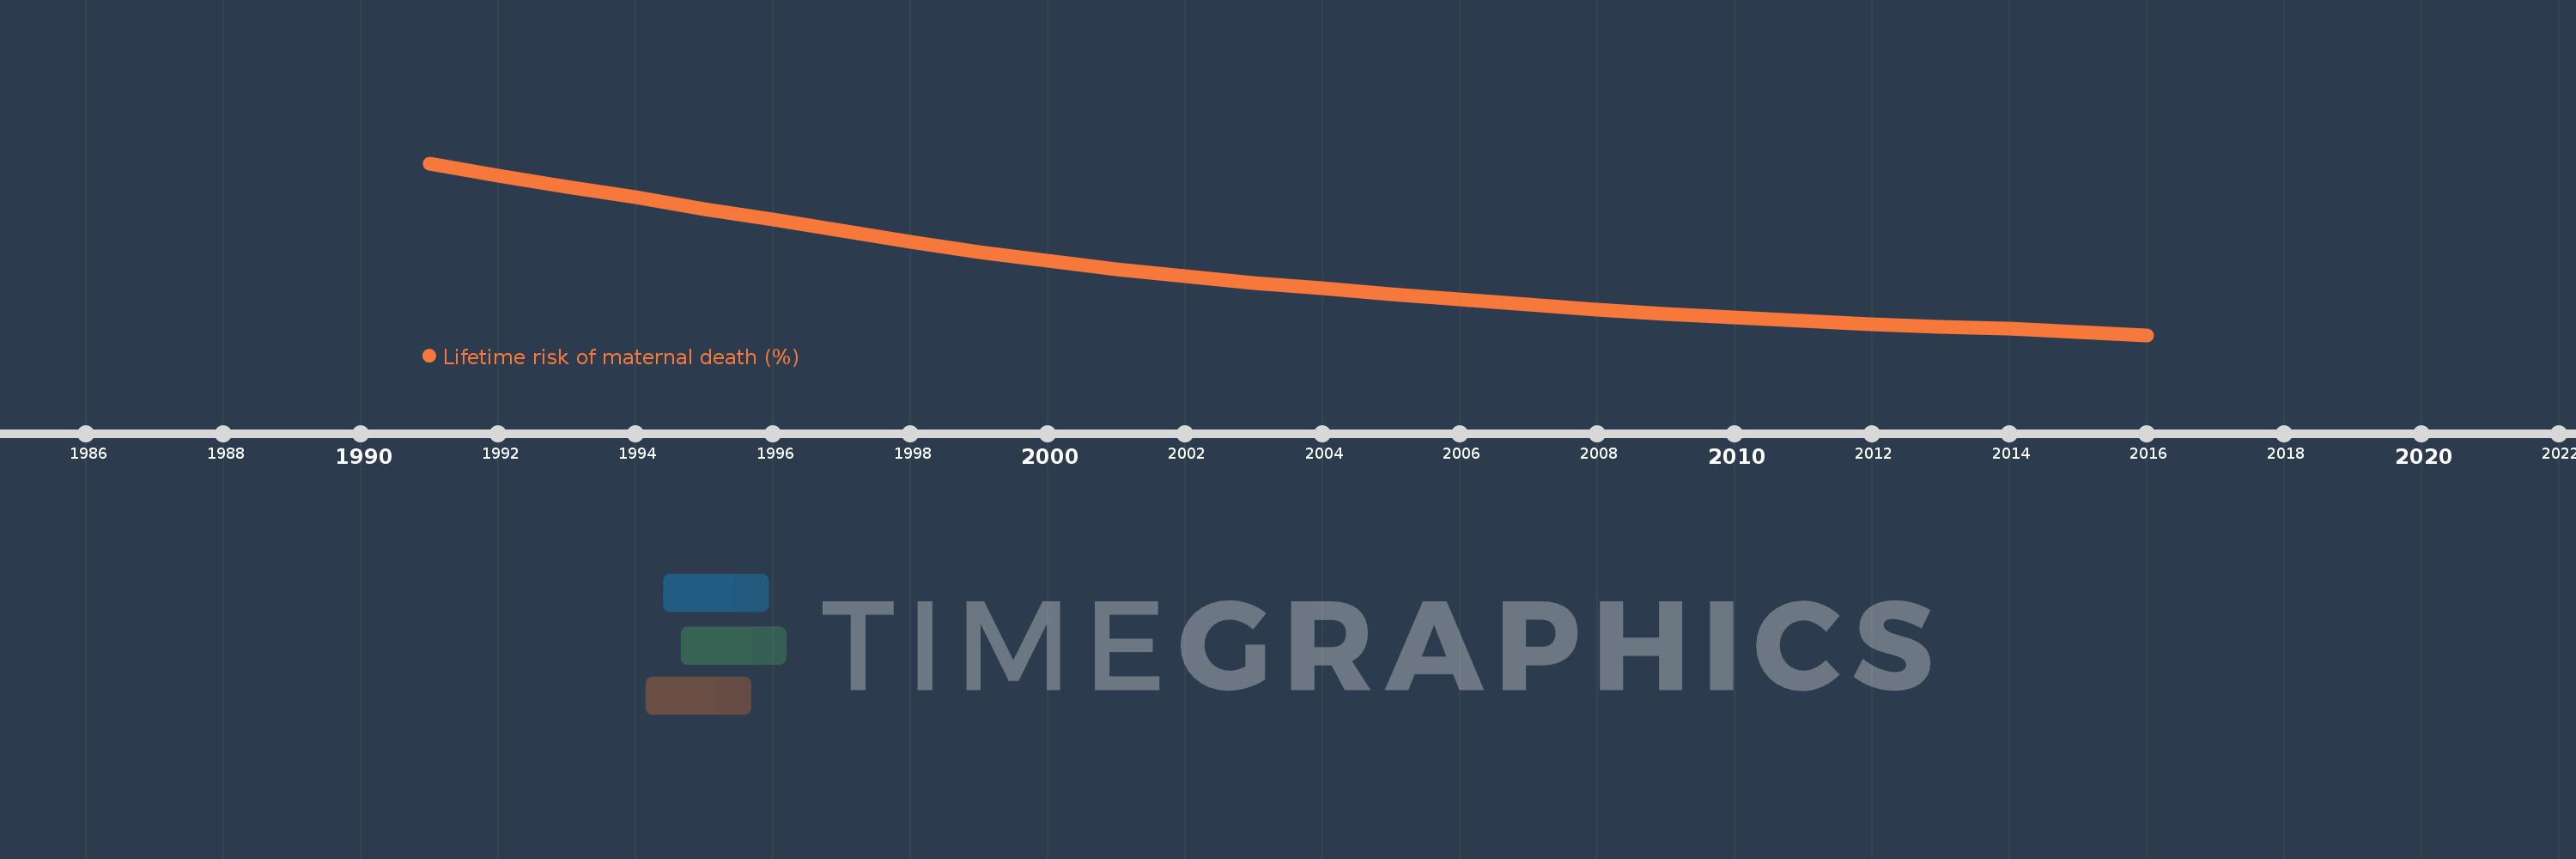
This timeline shows a graph from 1991 to 2016 of Arab World. No data until 1990. Number of actual observations by date: 26.
Source name:
World Development Indicators
Source organization:
WHO, UNICEF, UNFPA, The World Bank, and the United Nations Population Division. Trends in Maternal Mortality: 1990 to 2015. Geneva, World Health Organization, 2015
Categories, topics:
Health, Gender
Last updated:
apr 23, 2017
Indicators value changes by year
Meaning:
0.925
Minimum:
0.561
jan 1, 2016
Maximum:
1.546
jan 1, 1991
At the date of observation
Value
Absolute change
Change from the previous value
jan 1, 1991
1.546
+1.546
0.0%
jan 1, 1992
1.473
-0.073
-4.71%
jan 1, 1993
1.411
-0.062
-4.19%
jan 1, 1994
1.35
-0.061
-4.32%
jan 1, 1995
1.284
-0.067
-4.93%
jan 1, 1996
1.222
-0.062
-4.81%
jan 1, 1997
1.16
-0.062
-5.06%
jan 1, 1998
1.097
-0.063
-5.45%
jan 1, 1999
1.038
-0.059
-5.36%
jan 1, 2000
0.986
-0.052
-5.02%
jan 1, 2001
0.938
-0.048
-4.83%
jan 1, 2002
0.899
-0.039
-4.18%
jan 1, 2003
0.861
-0.038
-4.22%
jan 1, 2004
0.828
-0.034
-3.91%
jan 1, 2005
0.795
-0.033
-3.94%
jan 1, 2006
0.764
-0.031
-3.94%
jan 1, 2007
0.734
-0.029
-3.86%
jan 1, 2008
0.706
-0.028
-3.79%
jan 1, 2009
0.682
-0.025
-3.49%
jan 1, 2010
0.661
-0.02
-3.0%
jan 1, 2011
0.641
-0.02
-3.08%
jan 1, 2012
0.625
-0.016
-2.5%
jan 1, 2013
0.61
-0.015
-2.42%
jan 1, 2014
0.597
-0.013
-2.09%
jan 1, 2015
0.58
-0.017
-2.83%
jan 1, 2016
0.561
-0.019
-3.24%
Ranking of countries by current statistics by years