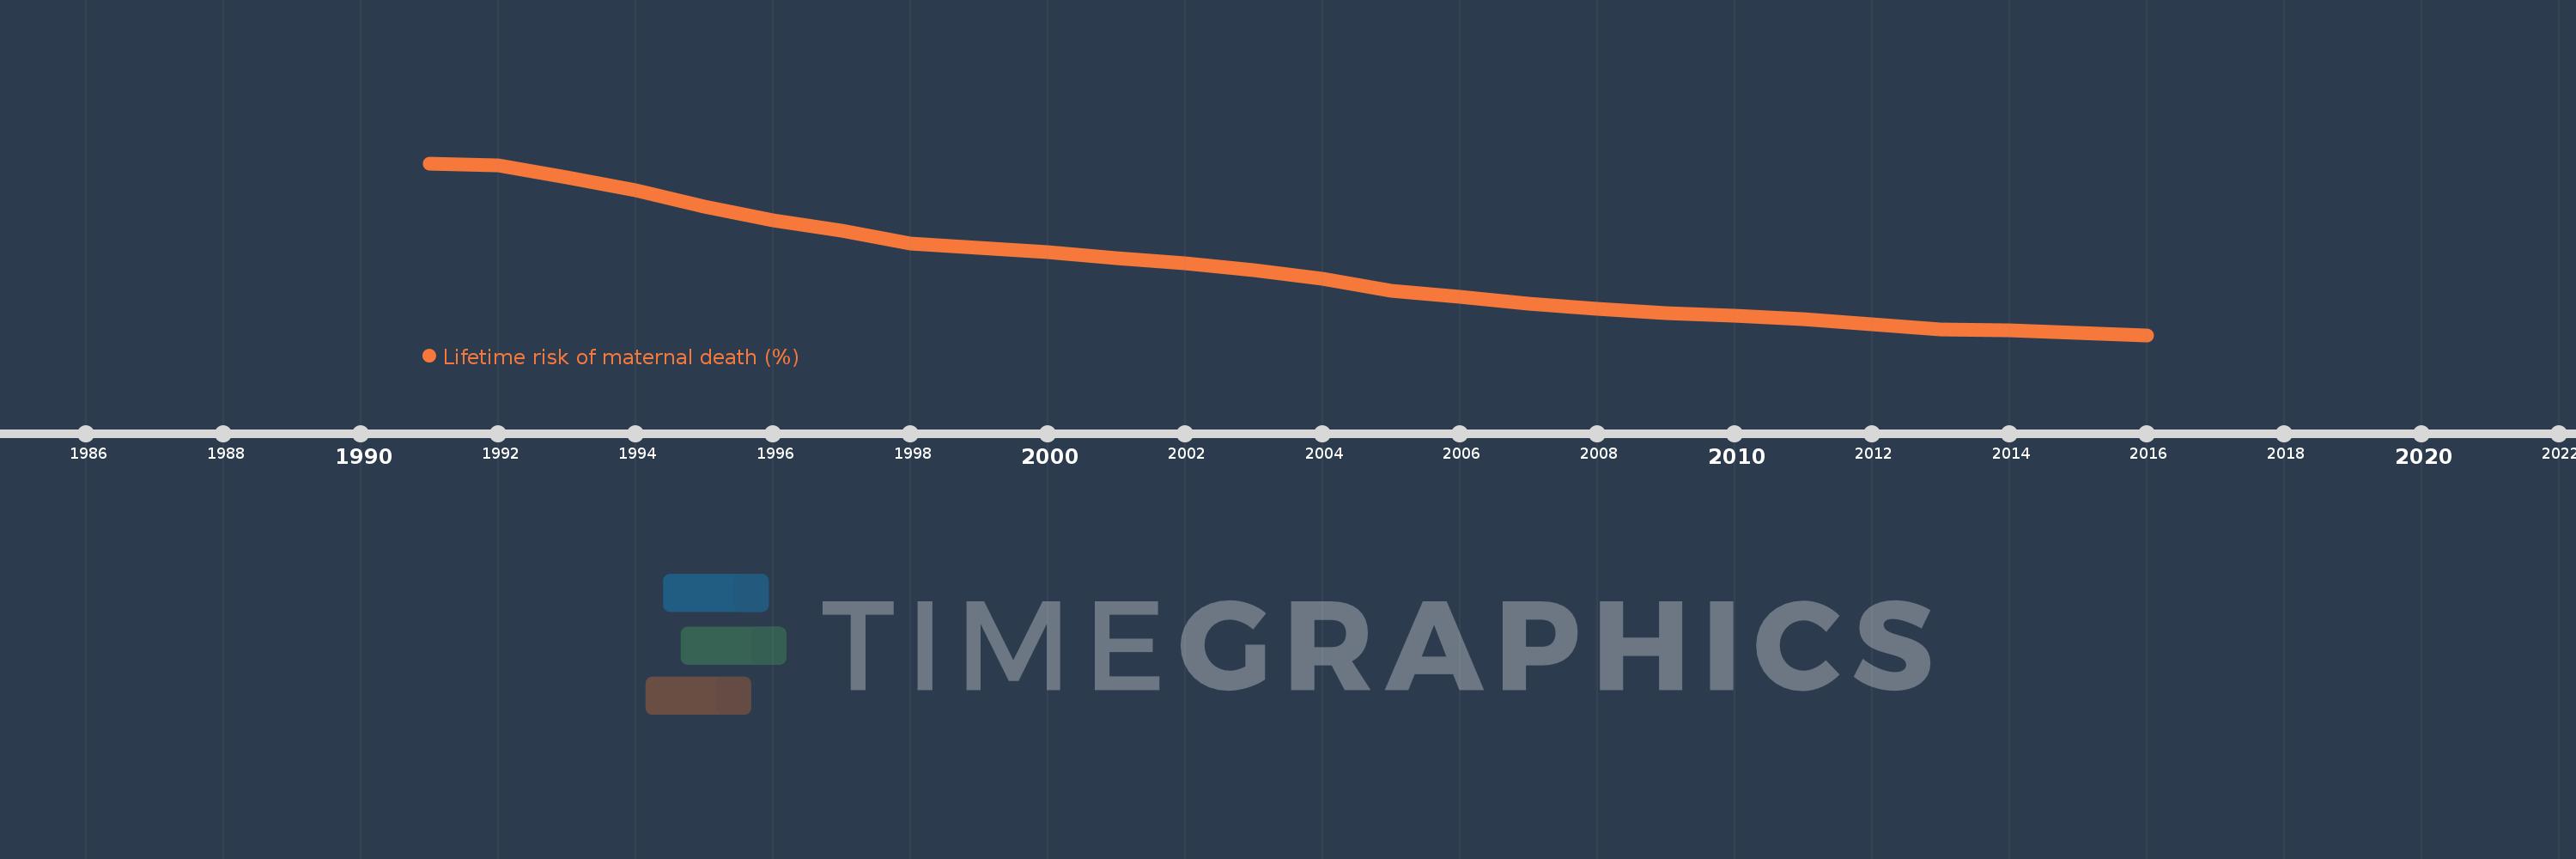
This timeline shows a graph from 1991 to 2016 of Colombia. No data until 1990. Number of actual observations by date: 26.
Source name:
World Development Indicators
Source organization:
WHO, UNICEF, UNFPA, The World Bank, and the United Nations Population Division. Trends in Maternal Mortality: 1990 to 2015. Geneva, World Health Organization, 2015
Categories, topics:
Health, Gender
Last updated:
apr 23, 2017
Indicators value changes by year
Meaning:
0.235
Minimum:
0.126
jan 1, 2016
Maximum:
0.405
jan 1, 1991
At the date of observation
Value
Absolute change
Change from the previous value
jan 1, 1991
0.405
+0.405
0.0%
jan 1, 1992
0.402
-0.003
-0.73%
jan 1, 1993
0.382
-0.02
-4.97%
jan 1, 1994
0.361
-0.021
-5.49%
jan 1, 1995
0.334
-0.028
-7.67%
jan 1, 1996
0.312
-0.022
-6.54%
jan 1, 1997
0.296
-0.016
-4.98%
jan 1, 1998
0.275
-0.021
-7.17%
jan 1, 1999
0.268
-0.007
-2.41%
jan 1, 2000
0.261
-0.007
-2.75%
jan 1, 2001
0.251
-0.01
-3.69%
jan 1, 2002
0.242
-0.01
-3.95%
jan 1, 2003
0.232
-0.009
-3.93%
jan 1, 2004
0.217
-0.015
-6.56%
jan 1, 2005
0.198
-0.019
-8.54%
jan 1, 2006
0.188
-0.011
-5.42%
jan 1, 2007
0.177
-0.01
-5.43%
jan 1, 2008
0.169
-0.009
-4.94%
jan 1, 2009
0.161
-0.008
-4.78%
jan 1, 2010
0.158
-0.003
-1.89%
jan 1, 2011
0.152
-0.005
-3.49%
jan 1, 2012
0.143
-0.009
-6.24%
jan 1, 2013
0.135
-0.007
-5.23%
jan 1, 2014
0.134
-0.001
-0.48%
jan 1, 2015
0.13
-0.004
-3.28%
jan 1, 2016
0.126
-0.004
-3.34%
Ranking of countries by current statistics by years