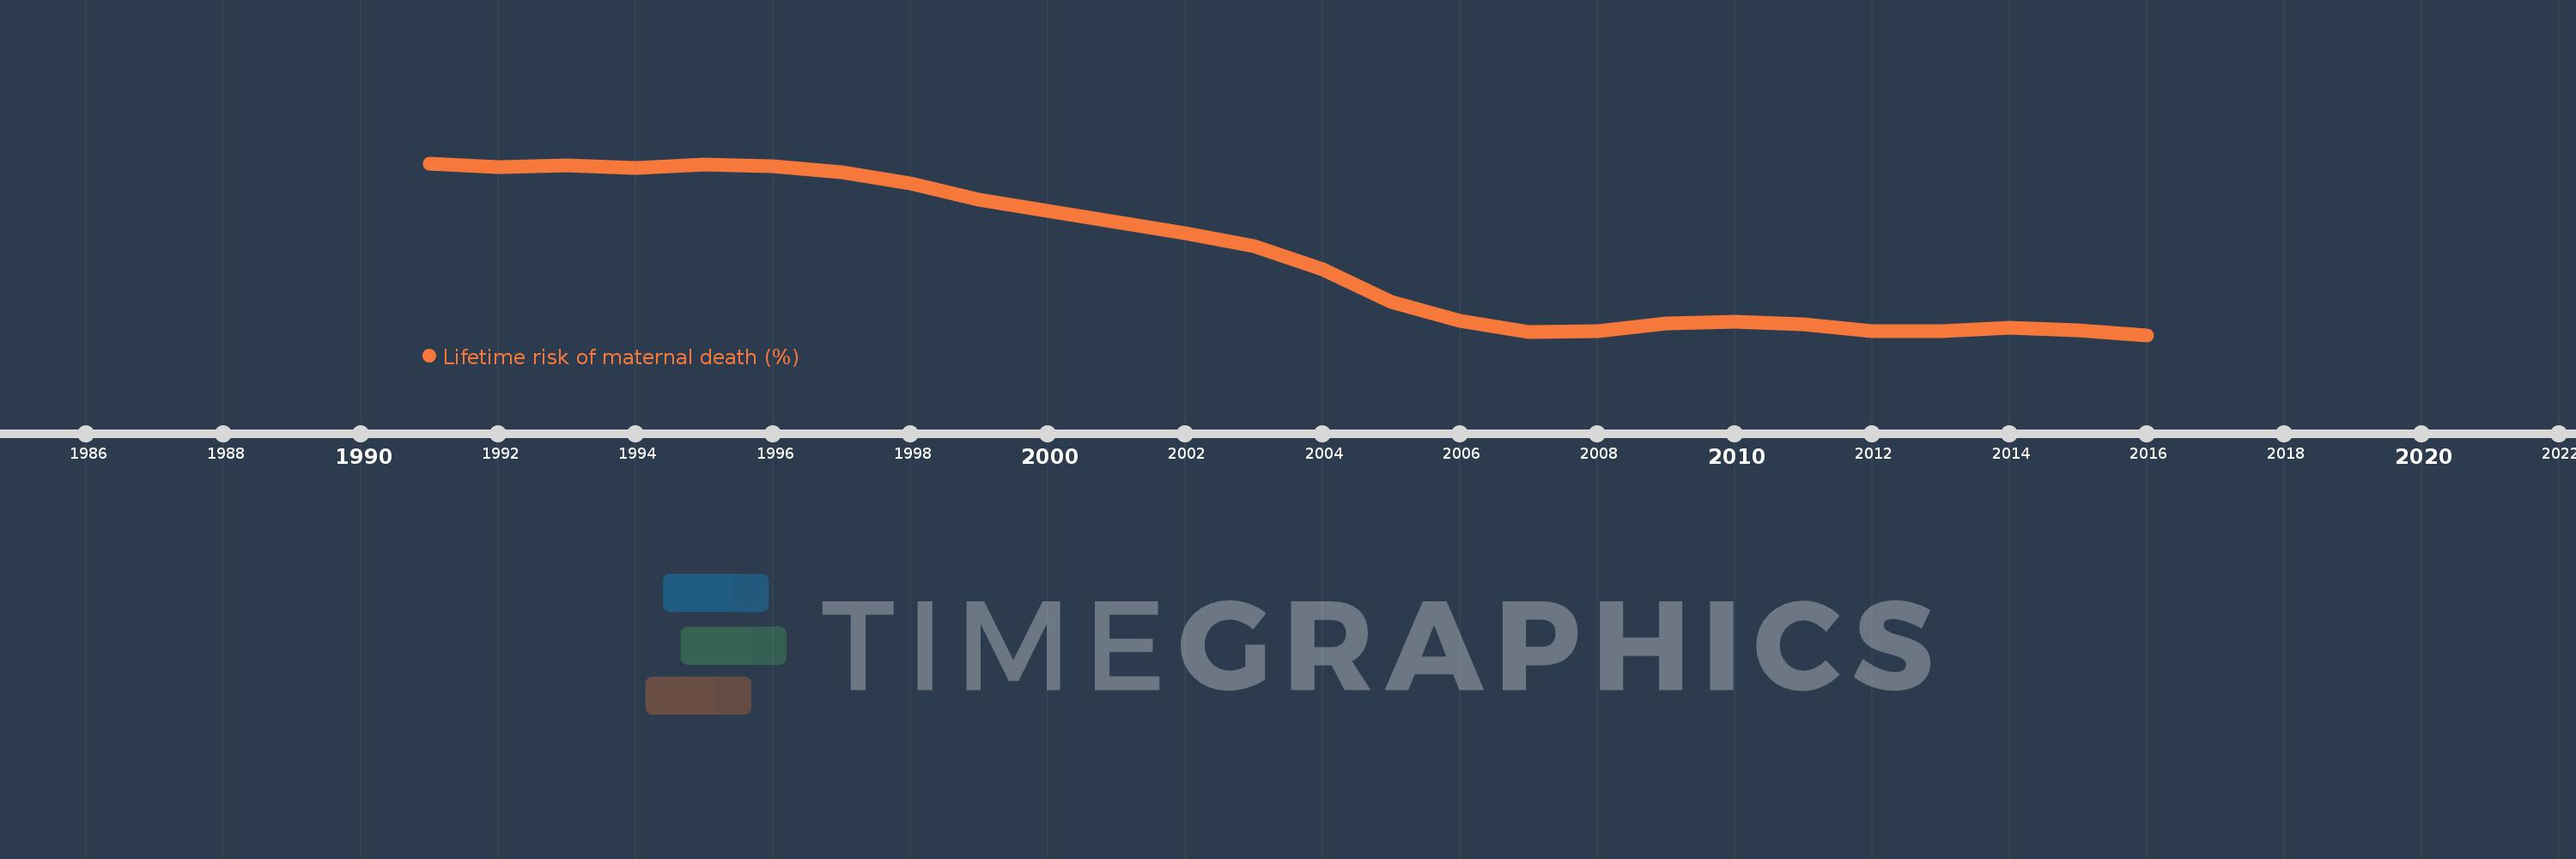
This timeline shows a graph from 1991 to 2016 of Malawi. No data until 1990. Number of actual observations by date: 26.
Source name:
World Development Indicators
Source organization:
WHO, UNICEF, UNFPA, The World Bank, and the United Nations Population Division. Trends in Maternal Mortality: 1990 to 2015. Geneva, World Health Organization, 2015
Categories, topics:
Health, Gender
Last updated:
apr 23, 2017
Indicators value changes by year
Meaning:
4.616
Minimum:
3.452
jan 1, 2016
Maximum:
5.965
jan 1, 1991
At the date of observation
Value
Absolute change
Change from the previous value
jan 1, 1991
5.965
+5.965
0.0%
jan 1, 1992
5.904
-0.06
-1.01%
jan 1, 1993
5.932
+0.028
0.47%
jan 1, 1994
5.894
-0.038
-0.64%
jan 1, 1995
5.951
+0.057
0.96%
jan 1, 1996
5.918
-0.033
-0.55%
jan 1, 1997
5.836
-0.082
-1.38%
jan 1, 1998
5.667
-0.169
-2.9%
jan 1, 1999
5.43
-0.237
-4.18%
jan 1, 2000
5.267
-0.163
-3.01%
jan 1, 2001
5.109
-0.158
-3.0%
jan 1, 2002
4.942
-0.167
-3.27%
jan 1, 2003
4.749
-0.193
-3.9%
jan 1, 2004
4.419
-0.33
-6.95%
jan 1, 2005
3.942
-0.478
-10.81%
jan 1, 2006
3.664
-0.278
-7.04%
jan 1, 2007
3.493
-0.171
-4.67%
jan 1, 2008
3.513
+0.02
0.58%
jan 1, 2009
3.618
+0.105
2.98%
jan 1, 2010
3.648
+0.03
0.82%
jan 1, 2011
3.606
-0.041
-1.13%
jan 1, 2012
3.504
-0.102
-2.84%
jan 1, 2013
3.512
+0.008
0.23%
jan 1, 2014
3.559
+0.047
1.33%
jan 1, 2015
3.524
-0.035
-0.97%
jan 1, 2016
3.452
-0.072
-2.04%
Ranking of countries by current statistics by years