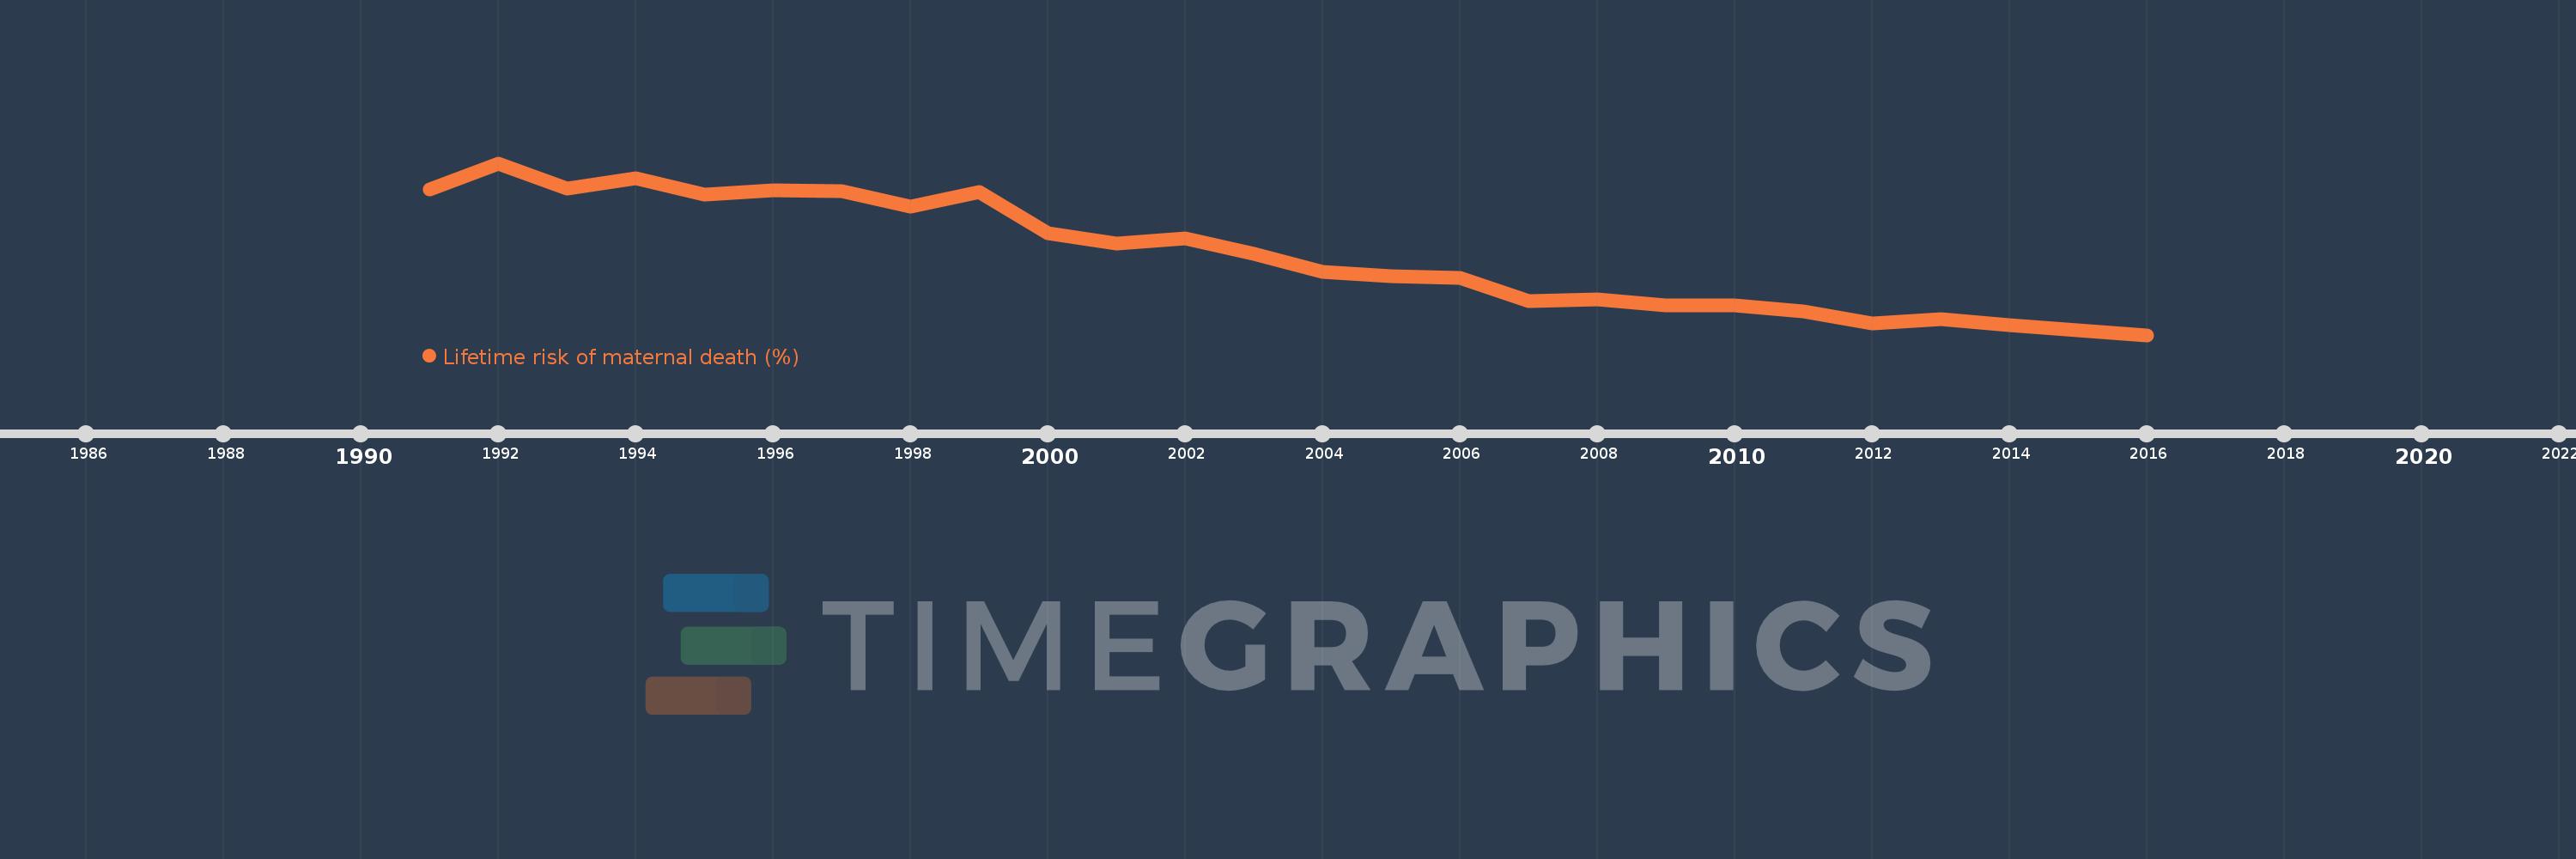
This timeline shows a graph from 1991 to 2016 of Nicaragua. No data until 1990. Number of actual observations by date: 26.
Source name:
World Development Indicators
Source organization:
WHO, UNICEF, UNFPA, The World Bank, and the United Nations Population Division. Trends in Maternal Mortality: 1990 to 2015. Geneva, World Health Organization, 2015
Categories, topics:
Health, Gender
Last updated:
apr 23, 2017
Indicators value changes by year
Meaning:
0.678
Minimum:
0.371
jan 1, 2016
Maximum:
1.036
jan 1, 1992
At the date of observation
Value
Absolute change
Change from the previous value
jan 1, 1991
0.934
+0.934
0.0%
jan 1, 1992
1.036
+0.101
10.85%
jan 1, 1993
0.938
-0.098
-9.42%
jan 1, 1994
0.978
+0.04
4.23%
jan 1, 1995
0.914
-0.064
-6.59%
jan 1, 1996
0.931
+0.017
1.9%
jan 1, 1997
0.929
-0.002
-0.21%
jan 1, 1998
0.868
-0.061
-6.55%
jan 1, 1999
0.924
+0.056
6.47%
jan 1, 2000
0.764
-0.16
-17.32%
jan 1, 2001
0.724
-0.04
-5.24%
jan 1, 2002
0.745
+0.021
2.84%
jan 1, 2003
0.685
-0.059
-7.98%
jan 1, 2004
0.614
-0.071
-10.43%
jan 1, 2005
0.6
-0.014
-2.25%
jan 1, 2006
0.591
-0.009
-1.46%
jan 1, 2007
0.501
-0.09
-15.27%
jan 1, 2008
0.51
+0.009
1.88%
jan 1, 2009
0.485
-0.025
-4.93%
jan 1, 2010
0.487
+0.002
0.42%
jan 1, 2011
0.461
-0.027
-5.45%
jan 1, 2012
0.416
-0.045
-9.77%
jan 1, 2013
0.433
+0.017
4.18%
jan 1, 2014
0.41
-0.023
-5.29%
jan 1, 2015
0.388
-0.022
-5.3%
jan 1, 2016
0.371
-0.018
-4.6%
Ranking of countries by current statistics by years